Choose the correct graph below.

College Algebra
7th Edition
ISBN:9781305115545
Author:James Stewart, Lothar Redlin, Saleem Watson
Publisher:James Stewart, Lothar Redlin, Saleem Watson
Chapter1: Equations And Graphs
Section: Chapter Questions
Problem 10T: Olympic Pole Vault The graph in Figure 7 indicates that in recent years the winning Olympic men’s...

Related questions
Question
100%
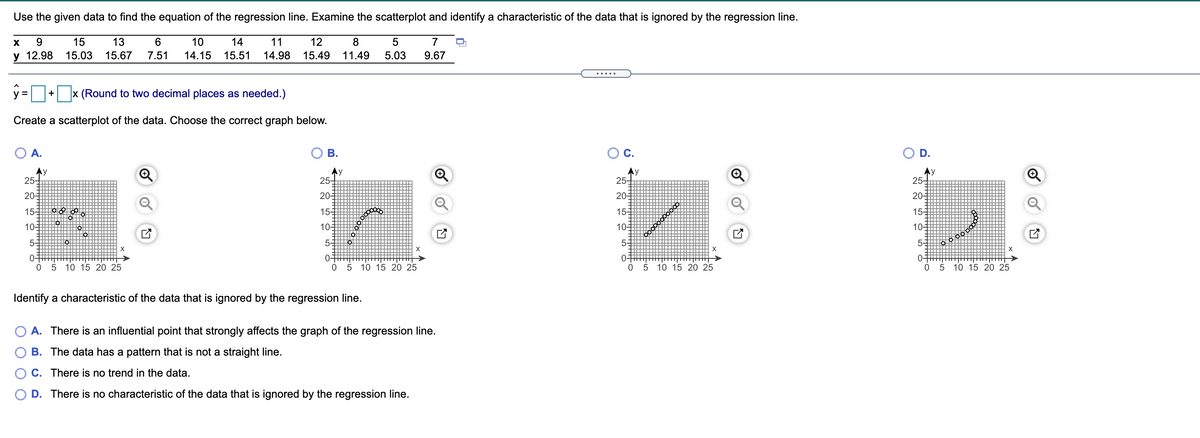
Transcribed Image Text:Use the given data to find the equation of the regression line. Examine the scatterplot and identify a characteristic of the data that is ignored by the regression line.
9.
15
13
6.
10
14
11
12
8
7
у 12.98
15.03
15.67
7.51
14.15
15.51
14.98
15.49
11.49
5.03
9.67
.....
y =
x (Round to two decimal places as needed.)
+
Create a scatterplot of the data. Choose the correct graph below.
A.
В.
Oc.
D.
Ay
25-
Ay
25-
Ay
25-
Ay
25-
20-
20-
204
20-
155
15
15-
15-
10-
10-
10=
10-
55
5-
5-
5-
X
X
0-
10 15 20 25
0-
05 10 15 20 25
05 10 15 20 25
05 10 15 20 25
Identify a characteristic of the data that is ignored by the regression line.
A. There is an influential point that strongly affects the graph of the regression line.
B. The data has a pattern that is not a straight line.
C. There is no trend in the data.
D. There is no characteristic of the data that is ignored by the regression line.
Expert Solution
This question has been solved!
Explore an expertly crafted, step-by-step solution for a thorough understanding of key concepts.

Step by step
Solved in 3 steps with 6 images

Recommended textbooks for you
College Algebra
Algebra
ISBN:
9781305115545
Author:
James Stewart, Lothar Redlin, Saleem Watson
Publisher:
Cengage Learning

Functions and Change: A Modeling Approach to Coll…
Algebra
ISBN:
9781337111348
Author:
Bruce Crauder, Benny Evans, Alan Noell
Publisher:
Cengage Learning
College Algebra
Algebra
ISBN:
9781305115545
Author:
James Stewart, Lothar Redlin, Saleem Watson
Publisher:
Cengage Learning
Functions and Change: A Modeling Approach to Coll…
Algebra
ISBN:
9781337111348
Author:
Bruce Crauder, Benny Evans, Alan Noell
Publisher:
Cengage Learning