Choose the following data according to your bachelor program and develop a stem and leaf. Then, find the mode. Table 1.2: Data for Civil students 42, 14, 22, 66, 12, 15, 78, 27, 6, 15, 19, 48, 4, 31, 26, 20, 28, 13, 10, 18, 13, 15, 48, 16, 15, 5, 18, 16, 28, 51, 10, 27, 28, 5, 4, 21, 18, 7, 12, 6, 40, 12, 2, 20, 15, 3, 16, 13, 8, 7, 65, 65, 25, 15, 21, 12, 12, 35, 30, 14, 35, 20, 35, 7, 35, 0, 0, 26, 36, 17,19, 15 Table 1.3: Data for Electrical students | 24, 34, 22, 16, 2, 15, 8, 27, 16, 15, 19, 38, 4, 31, 26, 20, 28, 13, 10, 18, 13, 65, 48, 16, 45, 5, 18, 56, 28, 11, 0, 57, 28, 5, 40, 21, 18, 7, 12, 6, 40, 12, 2, 20, 35, 3, 26, 13, 8, 7, 65, 75, 25, 15, 21, 71, 13, 5, 30, 24, 35, 20, 35, 7, 35, 0, 0, 26, 36, 17, 29, 15 Table 1.4: Data for Mechanical students 42, 14, 25, 16, 2, 15, 8, 27, 6, 65, 19, 38, 4, 31, 26, 20, 2, 13, 10, 18, 13, 15, 8, 16, 15, 5, 78, 16, 58, 11, 60, 27, 28, 5, 40, 21, 18, 7, 2, 56, 40, 12, 2, 20, 35, 3, 16, 13, 8, 7, 65, 65, 25, 15, 71, 12, 12, 35, 30, 14, 35, 20, 35, 7, 35, 0, 0, 6, 36, 17,19, 15
Choose the following data according to your bachelor program and develop a stem and leaf. Then, find the mode. Table 1.2: Data for Civil students 42, 14, 22, 66, 12, 15, 78, 27, 6, 15, 19, 48, 4, 31, 26, 20, 28, 13, 10, 18, 13, 15, 48, 16, 15, 5, 18, 16, 28, 51, 10, 27, 28, 5, 4, 21, 18, 7, 12, 6, 40, 12, 2, 20, 15, 3, 16, 13, 8, 7, 65, 65, 25, 15, 21, 12, 12, 35, 30, 14, 35, 20, 35, 7, 35, 0, 0, 26, 36, 17,19, 15 Table 1.3: Data for Electrical students | 24, 34, 22, 16, 2, 15, 8, 27, 16, 15, 19, 38, 4, 31, 26, 20, 28, 13, 10, 18, 13, 65, 48, 16, 45, 5, 18, 56, 28, 11, 0, 57, 28, 5, 40, 21, 18, 7, 12, 6, 40, 12, 2, 20, 35, 3, 26, 13, 8, 7, 65, 75, 25, 15, 21, 71, 13, 5, 30, 24, 35, 20, 35, 7, 35, 0, 0, 26, 36, 17, 29, 15 Table 1.4: Data for Mechanical students 42, 14, 25, 16, 2, 15, 8, 27, 6, 65, 19, 38, 4, 31, 26, 20, 2, 13, 10, 18, 13, 15, 8, 16, 15, 5, 78, 16, 58, 11, 60, 27, 28, 5, 40, 21, 18, 7, 2, 56, 40, 12, 2, 20, 35, 3, 16, 13, 8, 7, 65, 65, 25, 15, 71, 12, 12, 35, 30, 14, 35, 20, 35, 7, 35, 0, 0, 6, 36, 17,19, 15

Chapter6: Exponential And Logarithmic Functions
Section6.8: Fitting Exponential Models To Data
Problem 3TI: Table 6 shows the population, in thousands, of harbor seals in the Wadden Sea over the years 1997 to...

Related questions

Topic Video
Question
answer for Question1 a,b,c
Transcribed Image Text:iii)
Construct a frequency histogram with 5 classes and then discuss the skewness
of the distribution.
c)
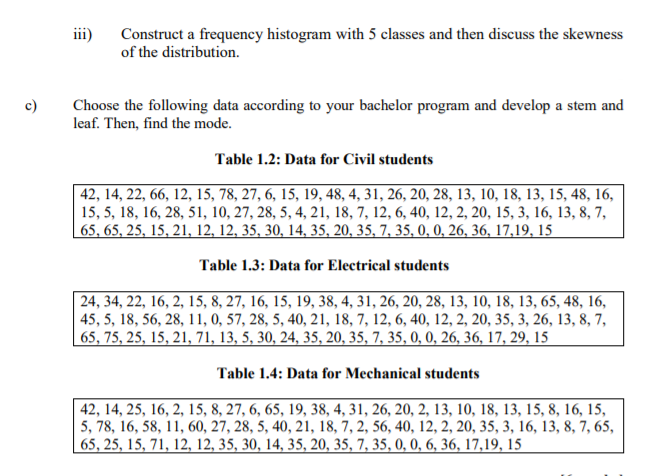
Choose the following data according to your bachelor program and develop a stem and
leaf. Then, find the mode.
Table 1.2: Data for Civil students
| 42, 14, 22, 66, 12, 15, 78, 27, 6, 15, 19, 48, 4, 31, 26, 20, 28, 13, 10, 18, 13, 15, 48, 16,
15, 5, 18, 16, 28, 51, 10, 27, 28, 5, 4, 21, 18, 7, 12, 6, 40, 12, 2, 20, 15, 3, 16, 13, 8, 7,
65, 65, 25, 15, 21, 12, 12, 35, 30, 14, 35, 20, 35, 7, 35, 0, 0, 26, 36, 17,19, 15
Table 1.3: Data for Electrical students
| 24, 34, 22, 16, 2, 15, 8, 27, 16, 15, 19, 38, 4, 31, 26, 20, 28, 13, 10, 18, 13, 65, 48, 16,
45, 5, 18, 56, 28, 11, 0, 57, 28, 5, 40, 21, 18, 7, 12, 6, 40, 12, 2, 20, 35, 3, 26, 13, 8, 7,
65, 75, 25, 15, 21, 71, 13, 5, 30, 24, 35, 20, 35, 7, 35, 0, 0, 26, 36, 17, 29, 15
Table 1.4: Data for Mechanical students
42, 14, 25, 16, 2, 15, 8, 27, 6, 65, 19, 38, 4, 31, 26, 20, 2, 13, 10, 18, 13, 15, 8, 16, 15,
5, 78, 16, 58, 11, 60, 27, 28, 5, 40, 21, 18, 7, 2, 56, 40, 12, 2, 20, 35, 3, 16, 13, 8, 7, 65,
65, 25, 15, 71, 12, 12, 35, 30, 14, 35, 20, 35, 7, 35, 0, 0, 6, 36, 17,19, 15
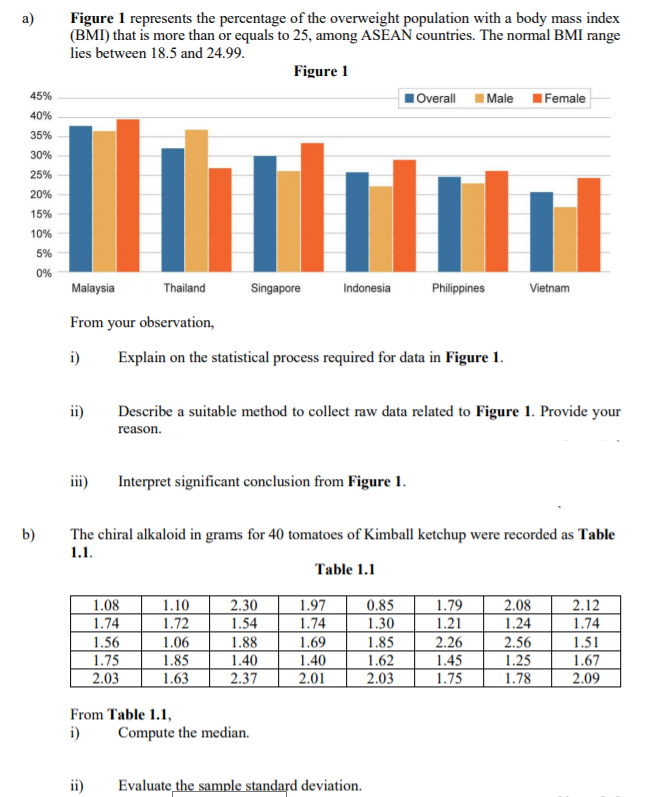
Transcribed Image Text:Figure 1 represents the percentage of the overweight population with a body mass index
(BMI) that is more than or equals to 25, among ASEAN countries. The normal BMI range
lies between 18.5 and 24.99.
Figure 1
I Male
45%
1Overall
IFemale
40%
35%
30%
25%
20%
15%
10%
5%
0%
Malaysia
Thailand
Singapore
Indonesia
Philippines
Vietnam
From your observation,
i)
Explain on the statistical process required for data in Figure 1.
ii)
Describe a suitable method to collect raw data related to Figure 1. Provide your
reason.
iii)
Interpret significant conclusion from Figure 1.
b)
The chiral alkaloid in grams for 40 tomatoes of Kimball ketchup were recorded as Table
1.1.
Table 1.1
1.08
1.74
1.56
1.75
2.03
1.97
1.79
1.10
1.72
1.06
1.85
1.63
2.30
1.54
0.85
1.30
1.85
1.62
2.03
2.08
1.24
2.56
1.25
1.78
2.12
1.74
1.51
1.67
1.74
1.21
1.88
1.40
2.37
1.69
2.26
1.45
1.40
2.01
1.75
2.09
From Table 1.1,
i)
Compute the median.
ii)
Evaluate the sample standard deviation.
Expert Solution
This question has been solved!
Explore an expertly crafted, step-by-step solution for a thorough understanding of key concepts.

Step by step
Solved in 3 steps

Knowledge Booster


Learn more about
Need a deep-dive on the concept behind this application? Look no further. Learn more about this topic, statistics and related others by exploring similar questions and additional content below.Recommended textbooks for you


Trigonometry (MindTap Course List)
Trigonometry
ISBN:
9781337278461
Author:
Ron Larson
Publisher:
Cengage Learning
Trigonometry (MindTap Course List)
Trigonometry
ISBN:
9781337278461
Author:
Ron Larson
Publisher:
Cengage Learning

Algebra & Trigonometry with Analytic Geometry
Algebra
ISBN:
9781133382119
Author:
Swokowski
Publisher:
Cengage

Functions and Change: A Modeling Approach to Coll…
Algebra
ISBN:
9781337111348
Author:
Bruce Crauder, Benny Evans, Alan Noell
Publisher:
Cengage Learning