Chpt 4, Q5: what is the correct answer for all the parts to this question In a study of the Gouldian finch, Griffith et al. (2011) looked at stress caused by having an incompatible mate. There are two genetically distinct types of Gouldian finches, one having a red face and the other having a black face. Previous experiments have shown that female finches have a strong preference for mating with males with the same face color as themselves, and that when different face types of finch mate with one another, their offspring are less likely to survive than when both parents are the same type. Researchers paired females sequentially with males of both types in random order. In other words, each female bred twice, once with a compatible male and once with an incompatible male. Each time, females produced a brood of young with the assigned male. For each pairing, the researchers measured blood corticosterone concentration (in units of ng/mL) as an index of the amount of stress the females experienced. Calculate the difference in stress levels by subtracting the corticosterone level of the female when matched with a compatible mate from the corticosterone level when matched with an incompatible mate. Plot the distribution of the differences in order to visually assess the distribution. It is EASY to plot the data in a histogram if you have the data analysis add-in installed on Microsoft Excel (Win (Links to an external site.)|Mac (Links to an external site.)). From the Data Analysis window, select histogram, and then make sure Pareto (sorted histogram) and Chart Output are checked. DATA: Compatible Mate Incompatible Mate 13 22 13 19 11 64 7 48 7 20 9 90 19 48 11 38 7 33 9 79 13 43 1 30 9 38 23 28 7 22 11 22 7 17 7 24 5 20 13 20 13 17 9 18 5 17 19 28 7 20 13 43 1 48 15 30 15 17 9 12 7 48 5 15 25 12 1 38 7 28 19 53 7 28 29 12 13 48 9 33 15 48 3 59 1 17


Chpt 4, Q5: what is the correct answer for all the parts to this question
In a study of the Gouldian finch, Griffith et al. (2011) looked at stress caused by having an incompatible mate. There are two genetically distinct types of Gouldian finches, one having a red face and the other having a black face. Previous experiments have shown that female finches have a strong preference for mating with males with the same face color as themselves, and that when different face types of finch mate with one another, their offspring are less likely to survive than when both parents are the same type.
Researchers paired females sequentially with males of both types in random order. In other words, each female bred twice, once with a compatible male and once with an incompatible male. Each time, females produced a brood of young with the assigned male. For each pairing, the researchers measured blood corticosterone concentration (in units of ng/mL) as an index of the amount of stress the females experienced.
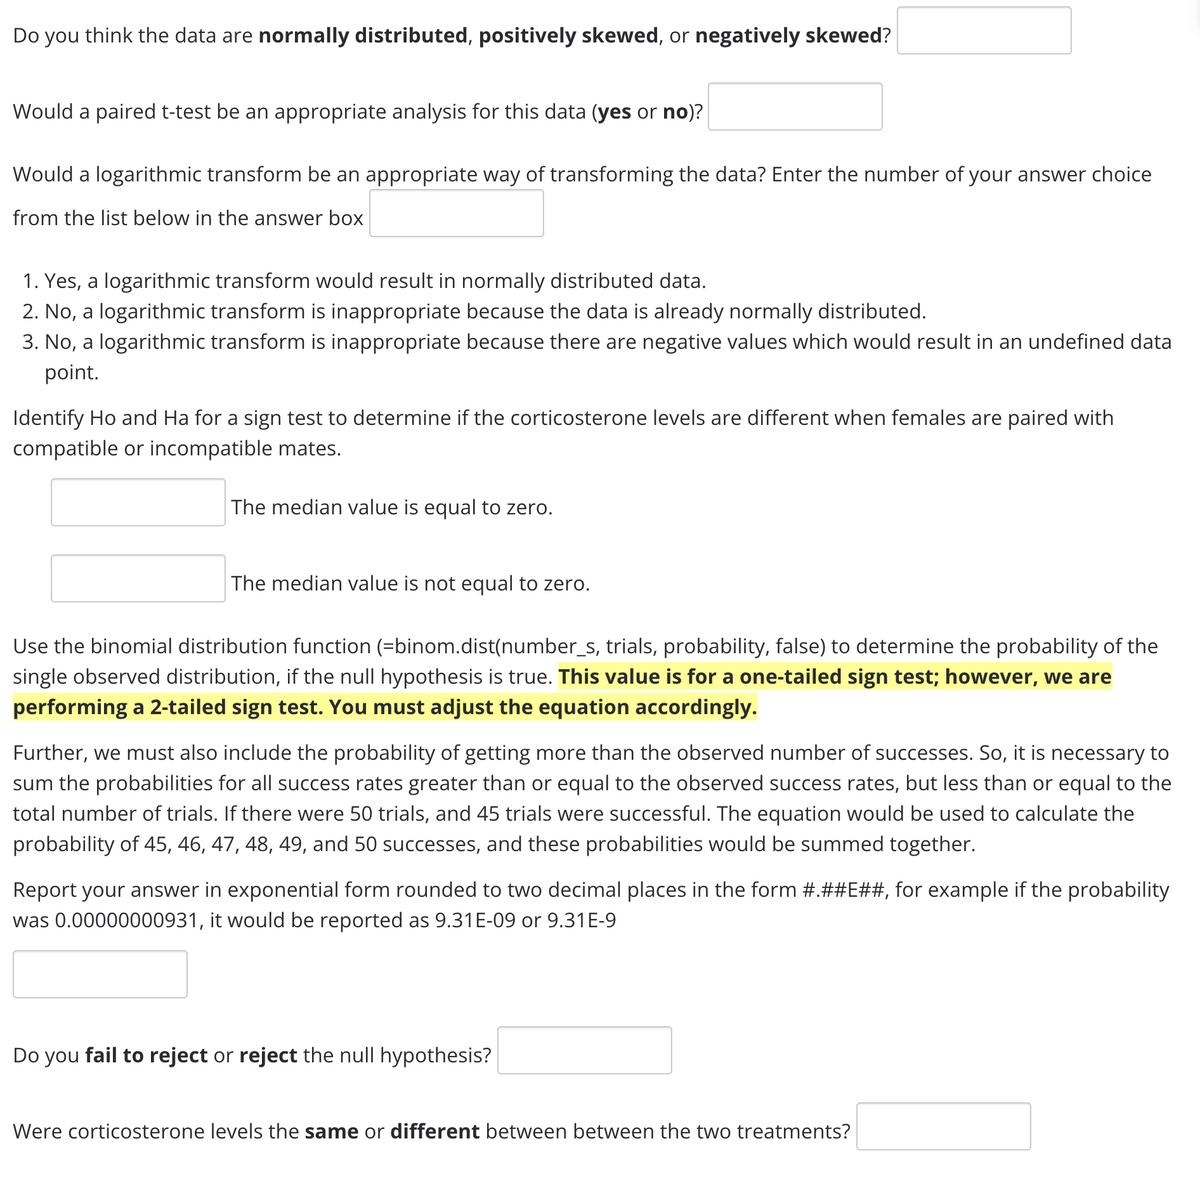
Calculate the difference in stress levels by subtracting the corticosterone level of the female when matched with a compatible mate from the corticosterone level when matched with an incompatible mate.
Plot the distribution of the differences in order to visually assess the distribution. It is EASY to plot the data in a histogram if you have the data analysis add-in installed on Microsoft Excel (Win (Links to an external site.)|Mac (Links to an external site.)). From the Data Analysis window, select histogram, and then make sure Pareto (sorted histogram) and Chart Output are checked.
DATA:
| Compatible Mate | Incompatible Mate |
| 13 | 22 |
| 13 | 19 |
| 11 | 64 |
| 7 | 48 |
| 7 | 20 |
| 9 | 90 |
| 19 | 48 |
| 11 | 38 |
| 7 | 33 |
| 9 | 79 |
| 13 | 43 |
| 1 | 30 |
| 9 | 38 |
| 23 | 28 |
| 7 | 22 |
| 11 | 22 |
| 7 | 17 |
| 7 | 24 |
| 5 | 20 |
| 13 | 20 |
| 13 | 17 |
| 9 | 18 |
| 5 | 17 |
| 19 | 28 |
| 7 | 20 |
| 13 | 43 |
| 1 | 48 |
| 15 | 30 |
| 15 | 17 |
| 9 | 12 |
| 7 | 48 |
| 5 | 15 |
| 25 | 12 |
| 1 | 38 |
| 7 | 28 |
| 19 | 53 |
| 7 | 28 |
| 29 | 12 |
| 13 | 48 |
| 9 | 33 |
| 15 | 48 |
| 3 | 59 |
| 1 | 17 |


Trending now
This is a popular solution!

Step by step
Solved in 2 steps with 2 images


