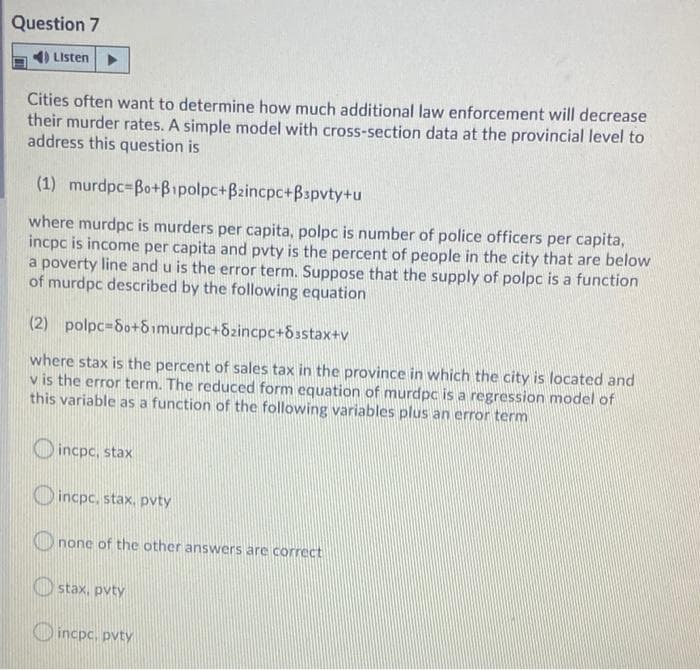
Cities often want to determine how much additional law enforcement will decrease their murder rates. A simple model with cross-section data at the provincial level to address this question is (1) murdpc=Bo+Bipolpc+Bzincpc+Bspvty+u where murdpc is murders per capita, polpc is number of police officers per capita, incpc is income per capita and pvty is the percent of people in the city that are below a poverty line and u is the error term. Suppose that the supply of polpc is a function of murdpc described by the following equation
Q: An independent variable in a model is also called: a. explained variable. b. unexplained variable.…
A: Option (c).
Q: Suppose you are a manager for a carnival game at the local fair. You want to estimate how many…
A: The standard error of the regression shows how far the observed values deviate from the regression…
Q: (f) Regression line drawn by the method of Least square is called as the line of (g) Link Relatives…
A: (f) Regression line drawn by the method of Least square is called as the line of best fit .…
Q: Using Y as the dependent variable and X1, X2, X3, X4 and X5 as the explanatory variables, formulate…
A:
Q: Choosing the best nearest neighbor regression model means
A: KNN regression is a non-parametric method that approximates the relationship between independent…
Q: Discuss and explain each of the assumptions of the simple linear regression model.
A: Simple linear regression model estimates the relationship between independent and dependent…
Q: Pls help with this homework.
A: Lets say that quantity of housing demanded is the dependent variable and price of house is the…
Q: Problem 2: Consider a data set consisting of observations on i = 1,... ,n units over t = 1,...,T…
A: The data set has n = 5000 and T = 10 years, i.e. there are 5000 cross-sectional units and 10 time…
Q: Assume that you want to study the effect of an increase in minimum wages on unemployment rates using…
A: The Linear regression equation depicts the linear relationship between a dependent variable and the…
Q: In the above model
A: In the above model, equilibrium is achieved by intersecting the IS and LM curves. Points of…
Q: Suppose you have a random sample of 500 individuals working in Canada, including data on hourly…
A: The multiple regression analysis is generally used to see how changes in a particular explanatory…
Q: What are the consequences in the regression results if multicollinearity is present in the…
A: Regression is defined as a statistical method that aims to determine the strength and character of…
Q: What are the most important remaining threats to the internal validity of this regression analysis?
A: Answer - There are many important threats to the internal validity of the regression analysis some…
Q: drugs to people to decrease their cholesterol level. Health professionals also collected a sample of…
A: health professional randomly assigned the drug to individual, independent of unobserved…
Q: Suppose that the true data-generating process includes an intercept along with the variables X2 and…
A: Data generating process is a kind of process which is generated through stochastic process in…
Q: After interviewing WWII concentration camp survivors, a researcher submits the interview transcripts…
A: Quantitative analysis refers to determining a relationship between variables using mathematical and…
Q: List the 5 assumptions of the Classical Linear Regression Model and explain at least three of them
A: Linear regression model- Linear regression attempts to model the relation between two variables by…
Q: (a)Heteroscedasticity can lead to A. smaller t values B. all of the statements are correct C.…
A: Heteroscedasticity occurs when the variance of the dependent variable is not constant. Even with…
Q: You work for a pharmaceutical multinational enterprise (MNE) that sells flu shots, which re…
A: 4) The data shows that the firm needs a large population or large scale to be viable than…
Q: A regional manager at a supermarket chain would like to develop a model to predict weekly sales of…
A: Use the below formula to find the covariance. Covariance = ∑x-x¯y-y¯N-1
Q: Issues of multicollinearity impacted the ‘validity and trustworthiness’ of a regression model.…
A: Multicollinearity refers to the independence of explanatory variables when two or more independent…
Q: ed Cordaro is an analytics consultant who has been brought into a large distribution company to…
A: Human resources are a set of people who make up the workforce of an organization, business,…
Q: Addition of explanatory variables in a regression model increases the value of _____. Select one: a.…
A: Option (c) is correct.
Q: The overall significance of an estimated multiple regression model is tested by using _____.
A: This helps to understand linear regression model fit to the data.
Q: Which of the following are plausible approaches to dealing with a model that exhibits…
A: Heteroscedasticity is used in regression where scedasticity refers to variance and hetero means…
Q: The following data are given based on 10 pairs of observations on Y and X. Given the population…
A:
Q: Suppose we use the linear probability model to estimate the effect of household income on the…
A: Willingness = 22.34 - 0.04HouseholdIncome Therefore, 22.34 is the Intercept -0.04 is the slope…
Q: Suppose you use this data to estimate the following model: Score = Bo + B1 × Major + B2 × Hours + B3…
A: We have regression equation, where score is dependents on number of hours of study and types of an…
Q: Issues of multicollinearity impacted the ‘validity and trustworthiness’ of a regression model.…
A: Multicollinearity is a state where at-lease two explanatory variables are highly related to each…
Q: QUESTION THREE Model comparison is very important in econometric analysis. Mr Homoscedasticity…
A: Given information There are 2 models: Restricted and Unrestricted model. Sample size= 542 Number of…
Q: If a regression equation contains an irrelevant variable, the parameter estimates will be Select…
A: Option (a) is correct.
Q: How is imperfect collinearity of regressors different from perfect collinearity?Compare the…
A: Perfect collinearity: Perfect collinearity refers to the presence of a perfect linear relationship…
Q: The population of a town has been growing, following the equation P=800t+5500P=800t+5500, where t is…
A: Given,Population has been growing according to the equation P = 800t+5500Number of restaurants are…
Q: Heteroskedasticity problem may arise owing to _____. Select one: a. presence of outliers in data b.…
A: Option (d).
Q: According to Environmental Kuznets curve, it is expected that there is an Inverse-U shape…
A: Given: Dependent Variable = Y Independent Variable = X Y represents Air pollution X represents Real…
Q: Can we compare the linear-log model and the log-log model? Which of the log regression models best…
A: The log-log model and linear-log model differs only in the functional form of dependent variables.…
Q: Based on data from 63 counties, the following model was estimated by least squares:ŷ = 0.58 -…
A: The regression function shows the linear relationship between dependent variable and independent…
Q: True or False? WLS is preferred to OLS when an important variable has been omitted from the model.
A: The given statement is false.
Q: Which one of the following is NOT an assumption of the classical linear regression model (CLRM)?…
A: (b) The dependent variable is not correlated with the disturbance terms. is NOT an assumption of the…
Q: Nadya is worried about poor people disproportionately exposed to pollution. She suggests the model…
A: Problem Recognition Poor people are disproportionately exposed to pollution. Pollution is adversely…
Q: 1. The following model is a simplified version of the multiple regression model used by Biddle and…
A:
Q: Explain what multicollinearity . What are the main problems that multicollinearity creates for OLS…
A: Multicollinearity is considered as the state that occurs as of high intercorrelations among two or…
Q: A manufacturer is developing a facility plan to provide production capacity for its factory. The…
A: Simple linear regression is a regression model that gauges the connection between one free factor…
Q: Consider the following case. Suppose that you have a pooled cross section data for year t (before…
A: The difference in difference method is used to evaluate the effect of any kind of program or…
Q: Describe the recommended approach towards determining model specification.How does the R2 help in…
A: According to guidelines, the first three sub parts needs to be answered. Regression analysis is an…
Q: The Hubbert Model can be used to
A: The Hubbert model is referred to as a model that predicts the rate of any finite resource over a…
Q: The Tiebout model is supported by the fact that residents within metropolitan suburbs have ____…
A: The Tiebout model is supported by the fact that residents within metropolitan suburbs have ____…
Q: Which model is the regression model given below called in econometrics?? y = Bo + Bix1 + Bx2 + Br3 +…
A: The simple linear regression is the study of relationship between one variable called dependent…
Q: 3. The following model is a simplified version of the multiple regression model used by BEST…
A: Since you have posted a question with multiple sub-parts, we will solve first three subparts for…
Step by step
Solved in 2 steps
- Using Y as the dependent variable and X1, X2, X3, X4 and X5 as the explanatoryvariables, formulate an econometric model for data that is (i) time series data (ii)cross-sectional data and (iii) panel data – (Hint: please specify the specific model herenot its general form).Demand can be estimated with experimental data, time-series data, or cross-section data. In this case, cross-section data appear in the Excel file. Soft drink consumption in cans per capita per year is related to six-pack price, income per capita, and mean temperature across the 48 contiguous states in the United States. Questions Howmanycans/capita/yearonsoftdrinkshouldbeforastateinwhich6-packprice=$1.95,Income/Capita=$23,500, and Mean Temp= 68 F ? Now omit the price and temperature from the regression equation. Should a marketing plan for soft drinks be designed that relocates most canned drink machines into low-income neighborhoods ? Why or why not ? TABLE 1. SOFT DRINK DEMAND DATA State Cans/Capita/Yr 6-Pack Price ($) Income/Capita ($1,000) Mean Temp. (F) Alabama 200 2.19 11.7 66 Arizona 150 1.99 15.3 62 Arkansas 237 1.93 9.9 63 California 135 2.59 22.5 56 Colorado 121 2.29 17.1 52 Connecticut 118 2.49 24.3 50 Delaware 217 1.99 25.2 52 Florida 242…In 2017, Philadelphia launched a sweetened beverage tax of 1.5 cents per ounce, raising the cost of a 2-liter soda bottle from about $1.50 to $2.50. One year later, the Philadelphia mayor wants to evaluate if this "sugar tax" improves the health status of Philadelphia Propose ONE method (i.e. difference-in-difference, instrumental variables, or regression discontinuity) to address these questions. write down its implementation details (the type of data you need, potential sources to get the data, equations) its pros and cons Only Typing answer please I need ASAP
- (Econmetrics) Q.1 How can you test for general misspecification of model if it would have only (any of) two independent variables?I dont understand why my question is being rejected so i'll resend this one. The data is attached in the image. Please help me with these questions. Thank you in advanced!! a. How many observations are included in the data? Is the data balanced?b. Is the above result estimated from the fixed effects model or the random effects model?c. Explain the meaning of the estimate coefficient of the variable ???Imagine you are trying to explain the effect of square footage on home sale prices in the United States. You collect a random sample of 100,000 homes that recently sold. a) Homes can be one of three types: single-family houses, townhomes, or condos. How would you control for a home’s type in a regression model? b) Write down a regression model that includes controls for home type, square footage, and number of bedrooms. c) How would you interpret the es3mated coefficients for each of the variables from part b? Be specific.
- We have estimated the impact of gross domestic product (GDP), energy consumption (ENERGY) and population (POP) on CO2 emiisions (CO2) in Cyprus. The results are as follows;Dependent Variable: CO2Method: Least SquaresDate: 04/20/17 Time: 09:46Sample: 1990 2013Included observations: 24 Write down the economic function for the above estimation by using the information obtained from above table b- Write down the economic model for the above estimation by using the information obtained from above table . c- Write down the econometric model for the above estimation by using the information obtained from above table d- Write down the least squares line by using the information obtained from above tablee- Explain what each coefficient of the least squares line indicatesExplain what multicollinearity . What are the main problems that multicollinearity creates for OLS estimation results ? Give two ways to detect multicollinearity problem and the hypothesis that are tested ?The population of a town has been growing, following the equation P=800t+5500P=800t+5500, where t is years after 2010. The number of restaurants in the town has been growing according to the equation R=2t+40R=2t+40.Complete an equation for the number of restaurants per capita (per person)Restaurants per capita: How many restaurants per capita does this model predict for the year 2017?
- Investigate what factors determine the number of times a person logs into Facebook per week. It is argued that these four factors are important: number of friends, age in years, whether the person is employed, and whether the student has a Twitter account. That is: FACEBOOK LOGIN=f(FRIENDS,AGE,EMPLOYED,TWITTER) Do you think other relevant explanatory variables should also be included? Name any two such variables and explain why they should be included in the regression.The Results below show the output of the following model: ?=?0+?1?1+?2?2+? Coefficient St. Error t-ratio Intercept 10.492 0.6655 15.77 ?1 0.0154 0.1889 0.08 ?2 0.1353 0.1889 0.72 Observations 100 ?2 0.985 Correlation matrix: X1 X2 X1 1 X2 0.950 1 Instructions: a. The above results show that the model has the problem of multicollinearity, what are the indicators of multicollinearity that can be identified from these results? b. What are the solutions to rectify multicollinearity?Problem 5. Based on a sample of 21 Monitoring the Future respondents (see table below), we present their racial/ethnic background and the number of school days missed in the past 4 weeks. White Black Hispanic 4 1 4 5 2 3 3 2 5 4 1 1 4 3 5 4 4 2 6 3 2 Complete the 5-step model for these data, and set alpha at 0.05. If alpha were set at 0.01, would your decision change? Explain.