Click here for the Excel Data File The weights you assign are unemployment rate 20%, stock prices 40%, County Price Index 25%, and retail sales 15%. (Round your answers to 1 decimal place.) a. Using 2000 as the base period, construct a leading economic indicator for 2018. Leading economic indicator


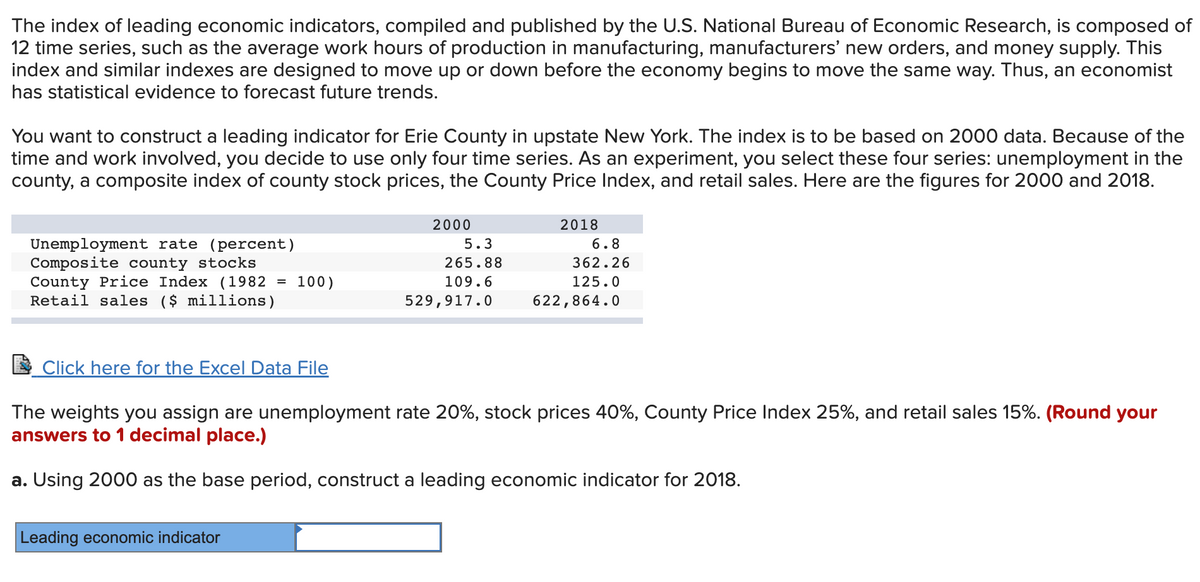
The index of leading economic indicators, compiled and published by the U.S. National Bureau of Economic Research, is composed of 12 time series, such as the average work hours of production in manufacturing, manufacturers’ new orders, and money supply. This index and similar indexes are designed to move up or down before the economy begins to move the same way. Thus, an economist has statistical evidence to forecast future trends.
You want to construct a leading indicator for Erie County in upstate New York. The index is to be based on 2000 data. Because of the time and work involved, you decide to use only four time series. As an experiment, you select these four series: unemployment in the county, a composite index of county stock prices, the County Price Index, and retail sales. Here are the figures for 2000 and 2018.
The weights you assign are unemployment rate 20%, stock prices 40%, County Price Index 25%, and retail sales 15%. (Round your answers to 1 decimal place.)
a. Using 2000 as the base period, construct a leading economic indicator for 2018.
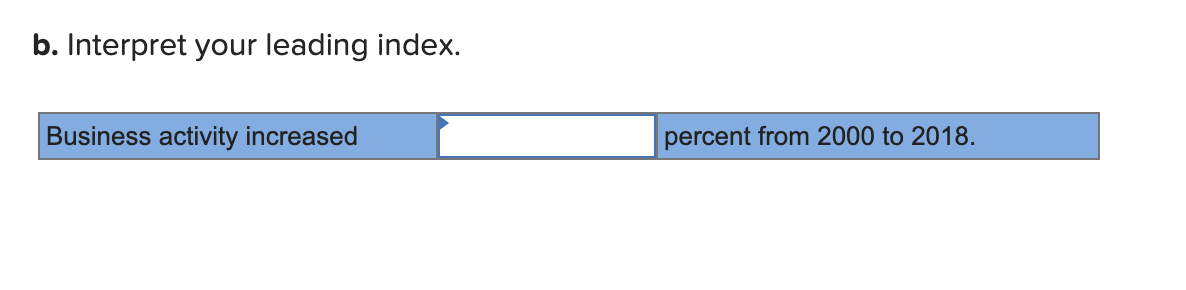
b. Interpret your leading index.


Trending now
This is a popular solution!

Step by step
Solved in 3 steps
