Climate Graphing Tools Figure 1-Global Temperature Differences Over Time MOVIST 1870 1800 1800 1900 1910 1920 1930 1940 1950 1960 Figure 2- Historical Carbon Dioxide Levels 1900 1990 2000 2010 2000 CURRENT over the last approximately 40 years (since 1980). Methane The anomalies or differences in global surface temperatures have concentrations have during that same time period. Since carbon dioxide and methane are greenhouse gases that in global surface temperatures over time, especially du the atmosphere, changes in their concentration have contributed to an years.
Climate Graphing Tools Figure 1-Global Temperature Differences Over Time MOVIST 1870 1800 1800 1900 1910 1920 1930 1940 1950 1960 Figure 2- Historical Carbon Dioxide Levels 1900 1990 2000 2010 2000 CURRENT over the last approximately 40 years (since 1980). Methane The anomalies or differences in global surface temperatures have concentrations have during that same time period. Since carbon dioxide and methane are greenhouse gases that in global surface temperatures over time, especially du the atmosphere, changes in their concentration have contributed to an years.

Applications and Investigations in Earth Science (9th Edition)
9th Edition
ISBN:9780134746241
Author:Edward J. Tarbuck, Frederick K. Lutgens, Dennis G. Tasa
Publisher:Edward J. Tarbuck, Frederick K. Lutgens, Dennis G. Tasa
Chapter1: The Study Of Minerals
Section: Chapter Questions
Problem 1LR

Related questions
Question
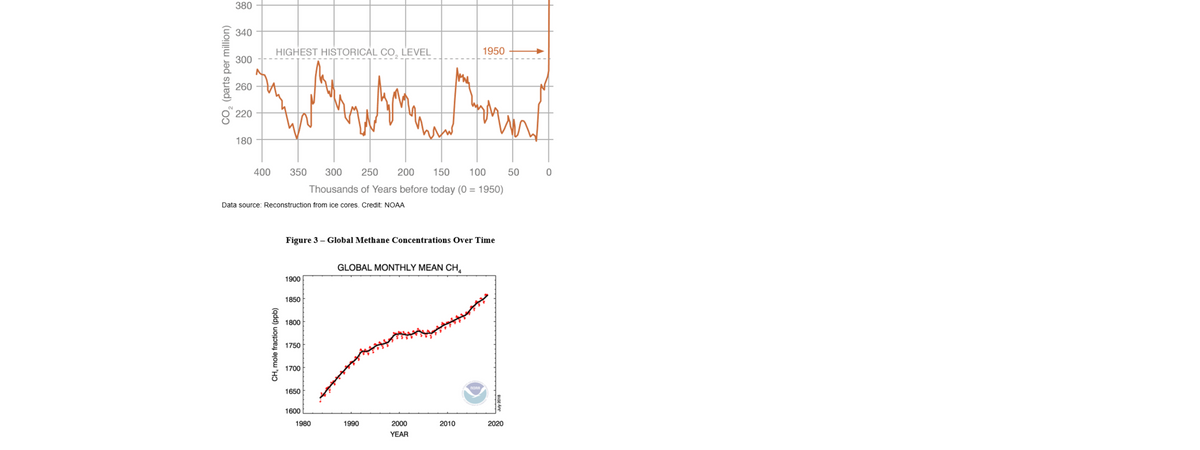
Transcribed Image Text:CO₂ (parts per million)
380
340
300
260
220
180
400
HIGHEST HISTORICAL CO, LEVEL
350
CH, mole fraction (ppb)
Data source: Reconstruction from ice cores. Credit: NOAA
1900
Figure 3 - Global Methane Concentrations Over Time
1850
1800
1750
1700
1650
300 250 200
150 100
Thousands of Years before today (0 = 1950)
1600
1980
GLOBAL MONTHLY MEAN CH4
1990
2000
YEAR
1950
2010
NORA
July 2018
2020
AN
50 0
Transcribed Image Text:The figures below show the levels of greenhouse gases in the atmosphere and changes in global mean surface temperatures over time. Use these figures to identify the patterns within and relationships between the data sets.
Global Temperature Anomaly (C) compared to 1901-2000
1.0
0.8
0.6
0.4
0.2
0.0
-0.2
-0.4
*Anomaly means difference; Data Source: NOAA Climate Graphing Tools
WOWINT
1870 1880 1890 1900 1910 1920 1930 1940 1950 1980 1970 1980 1990 2000
Year
CO₂ (parts per million)
380
340
HIGHEST HISTORICAL CO, LEVEL
but
300
260
220
Figure 1 - Global Temperature Differences Over Time
180
400
Figure 2 - Historical Carbon Dioxide Levels
CURRENT
1950
2010 2020
350 300 250 200
Thousands of Years before today (0 = 1950)
150 100 50 0
Select the best words to complete the statements explaining the relationships between global temperature differences (Figure 1) and atmospheric
concentrations of carbon dioxide (Figure 2) and methane (Figure 3) over the past 40 years.
The anomalies or differences in global surface temperatures have
concentrations have
✓over the last approximately 40 years (since 1980). Methane and carbon dioxide
during that same time period. Since carbon dioxide and methane are greenhouse gases that
the atmosphere, changes in their concentration have contributed to a(n)
years.
in global surface temperatures over time, especially during the last 40
Expert Solution
This question has been solved!
Explore an expertly crafted, step-by-step solution for a thorough understanding of key concepts.

Step by step
Solved in 2 steps

Recommended textbooks for you
Applications and Investigations in Earth Science …
Earth Science
ISBN:
9780134746241
Author:
Edward J. Tarbuck, Frederick K. Lutgens, Dennis G. Tasa
Publisher:
PEARSON

Exercises for Weather & Climate (9th Edition)
Earth Science
ISBN:
9780134041360
Author:
Greg Carbone
Publisher:
PEARSON

Environmental Science
Earth Science
ISBN:
9781260153125
Author:
William P Cunningham Prof., Mary Ann Cunningham Professor
Publisher:
McGraw-Hill Education
Applications and Investigations in Earth Science …
Earth Science
ISBN:
9780134746241
Author:
Edward J. Tarbuck, Frederick K. Lutgens, Dennis G. Tasa
Publisher:
PEARSON
Exercises for Weather & Climate (9th Edition)
Earth Science
ISBN:
9780134041360
Author:
Greg Carbone
Publisher:
PEARSON
Environmental Science
Earth Science
ISBN:
9781260153125
Author:
William P Cunningham Prof., Mary Ann Cunningham Professor
Publisher:
McGraw-Hill Education

Earth Science (15th Edition)
Earth Science
ISBN:
9780134543536
Author:
Edward J. Tarbuck, Frederick K. Lutgens, Dennis G. Tasa
Publisher:
PEARSON

Environmental Science (MindTap Course List)
Earth Science
ISBN:
9781337569613
Author:
G. Tyler Miller, Scott Spoolman
Publisher:
Cengage Learning

Physical Geology
Earth Science
ISBN:
9781259916823
Author:
Plummer, Charles C., CARLSON, Diane H., Hammersley, Lisa
Publisher:
Mcgraw-hill Education,