clude correctly labeled diagrams, if useful or required, in explaining your answers. A correctly peled diagram must have all axes and curves clearly labeled and must show directional changes. the question prompts you to "Calculate," you must show how you arrived at your final answer. S 8- 6- 4- 2- 0 1 2 9 10 Quantity (millions of cases) 3 4 5 7 8 Price per case ($)
clude correctly labeled diagrams, if useful or required, in explaining your answers. A correctly peled diagram must have all axes and curves clearly labeled and must show directional changes. the question prompts you to "Calculate," you must show how you arrived at your final answer. S 8- 6- 4- 2- 0 1 2 9 10 Quantity (millions of cases) 3 4 5 7 8 Price per case ($)

Microeconomics A Contemporary Intro
10th Edition
ISBN:9781285635101
Author:MCEACHERN
Publisher:MCEACHERN
Chapter5: Elasticity Of Demand And Supply
Section: Chapter Questions
Problem 14PAE

Related questions
Question
pls see attachments
Transcribed Image Text:Question 1
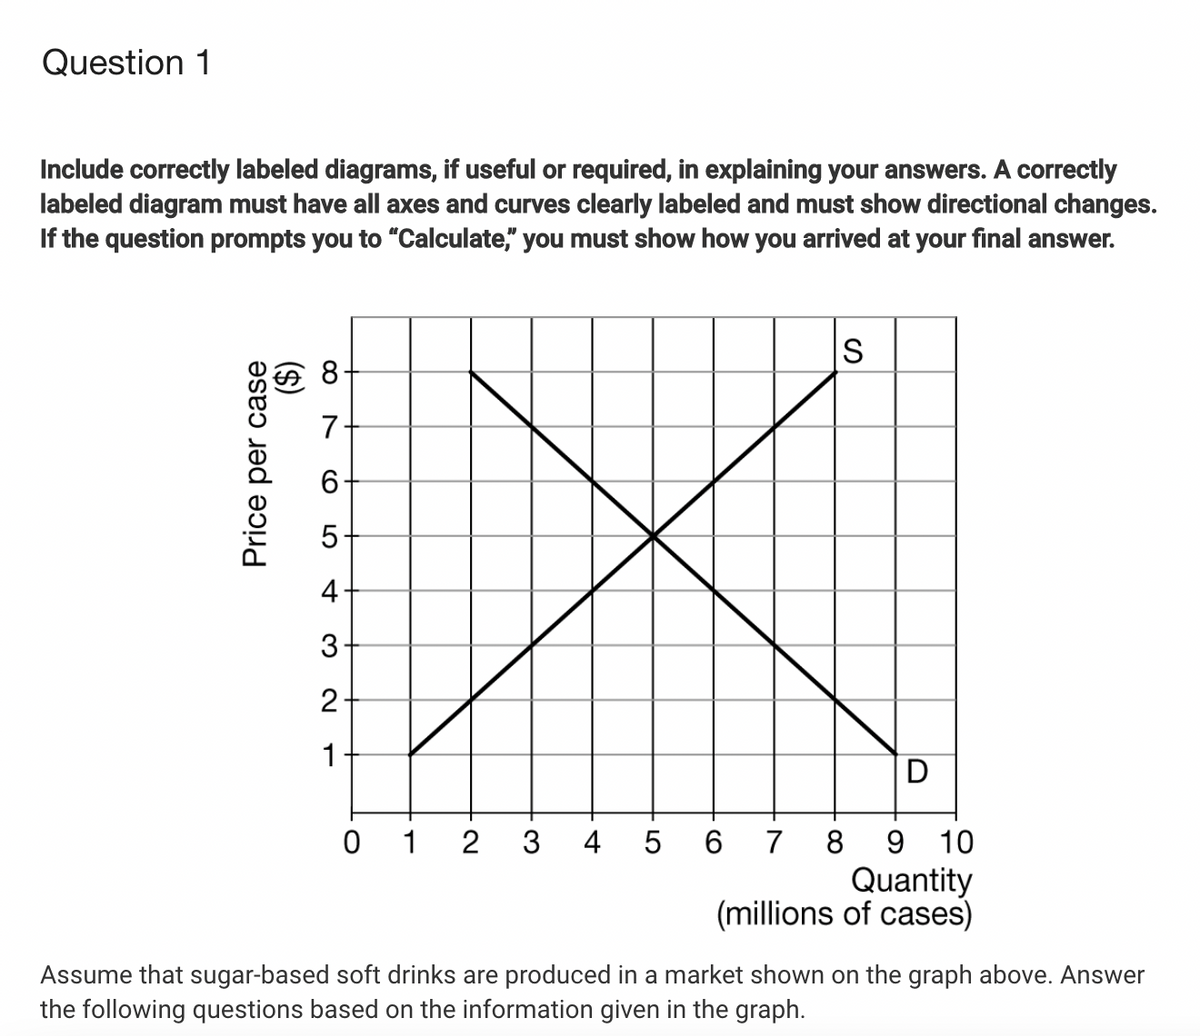
Include correctly labeled diagrams, if useful or required, in explaining your answers. A correctly
labeled diagram must have all axes and curves clearly labeled and must show directional changes.
If the question prompts you to "Calculate," you must show how you arrived at your final answer.
IS
8.
7
6.
5
2
1
D
0 1
3
4 5 6
7
8
10
Quantity
(millions of cases)
Assume that sugar-based soft drinks are produced in a market shown on the graph above. Answer
the following questions based on the information given in the graph.
Price per case
($)
4-
CO
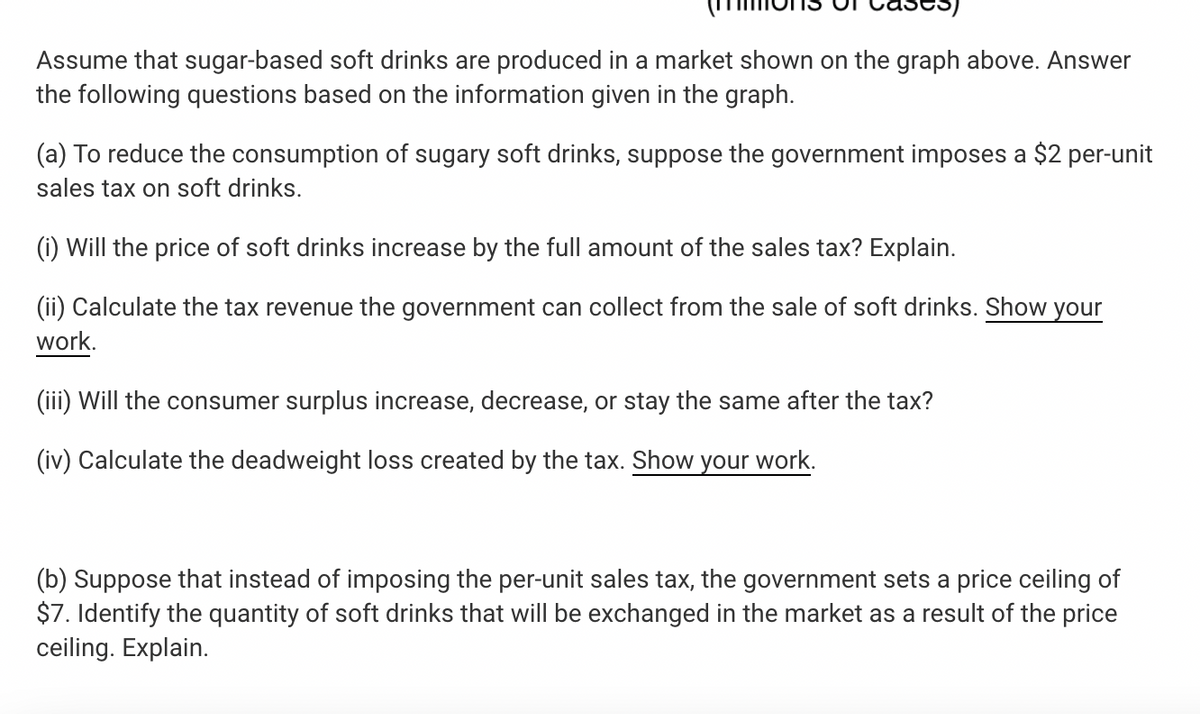
Transcribed Image Text:Assume that sugar-based soft drinks are produced in a market shown on the graph above. Answer
the following questions based on the information given in the graph.
(a) To reduce the consumption of sugary soft drinks, suppose the government imposes a $2 per-unit
sales tax on soft drinks.
(i) Will the price of soft drinks increase by the full amount of the sales tax? Explain.
(ii) Calculate the tax revenue the government can collect from the sale of soft drinks. Show your
work.
(iii) Will the consumer surplus increase, decrease, or stay the same after the tax?
(iv) Calculate the deadweight loss created by the tax. Show your work.
(b) Suppose that instead of imposing the per-unit sales tax, the government sets a price ceiling of
$7. Identify the quantity of soft drinks that will be exchanged in the market as a result of the price
ceiling. Explain.
Expert Solution
This question has been solved!
Explore an expertly crafted, step-by-step solution for a thorough understanding of key concepts.

This is a popular solution!

Trending now
This is a popular solution!

Step by step
Solved in 2 steps with 2 images

Recommended textbooks for you