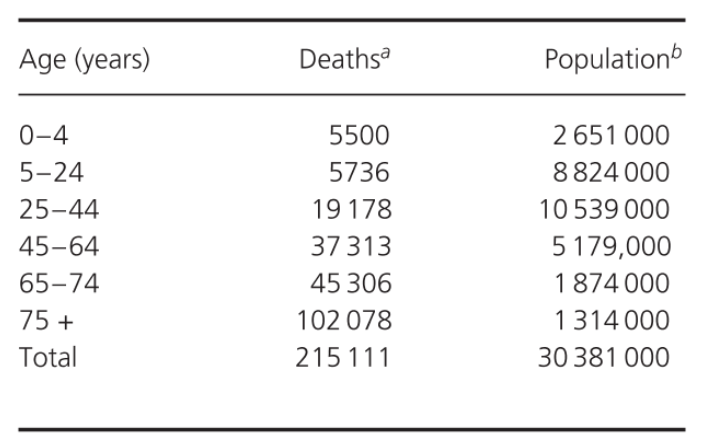
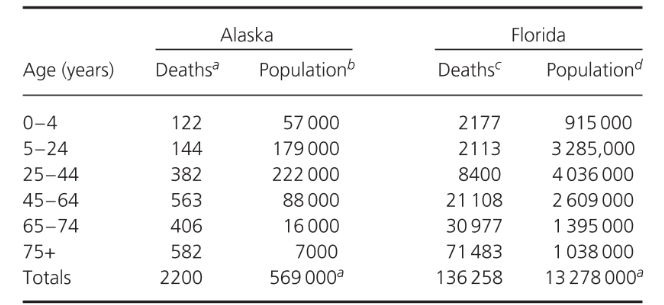
Compare California's adjusted rate with that of Florida. Use information in the table provide


Q: Considering that the dependent variable (DV) is continuous, what ANOVA procedure would you like to…
A: Considering that the dependent variable (DV) is continuous, what ANOVA procedure would you like to…
Q: According to a study done by Nick Wilson of Otago University Wellington, the probability a randomly…
A: In this case, each of the sneezing individuals has the only options of "covering his or her mouth"…
Q: Only typed explanation A hotel hosts banquets for conferences in a large ballroom with tables of…
A: Each server takes 3 minutes 18 seconds for each table.Number of tables Time taken to serve 18…
Q: A recent survey reported that 49% of 18- to 29-year-olds in a certain country own tablets. Using the…
A: Suppose a random variable x, defines that the number of 18-to-29-year-olds in a certain country.
Q: Consider the following data. Men Women Group 1 Group 2 24% Group 1 38 Group 1 Group 2 6 X % Given…
A: Group 1Group 2Group 3Total Men385071159Women6482983Total 4498100241Concept : P(A given B) = P(A and…
Q: You want to obtain a sample to estimate a population proportion. Based on previous evidence, you…
A: Population proportion(p)=19%=0.19Margin of error(E)=3.5%=0.035confidence level=95%
Q: There are 12 different types of chocolate candy entered in a chocolate-candy-tasting-contest. How…
A: Given,Total number of chocolate candy, n = 12We need to find the number of ways are there to choose…
Q: A class contains 8 boys and 7 girls. The teacher selects 3 of the children at random and without…
A: The probability shows how likely and event occurs.
Q: Four women's college basketball teams are participating in a single-elimination holiday basketball…
A: One team is favoured (1.40, 1.60) Another team is favoured (2.30, 1.70)
Q: ... The probability that a randomly selected woman will carry the gene mutation and develop bladder…
A: It is given that approximately 1 woman in 500 carries a mutation of a particular gene. About 45% of…
Q: There are 22 different flavors of ice cream in the ice cream store. Sammy can choose three of them…
A: Total number of flavors pf ice cream are 22.Sammy chose 3 of them for the sundae.
Q: The owner of Limp Pines Resort wanted to know the average age of its clients. A random sample of 25…
A: We have given that Sample size (n) = 25Sample mean (x̅) = 46Standard deviations (s) = 5Confidence…
Q: The National Highway Traffic Safety Administration reported the percentage of traffic accidents…
A: Given n = 7Null Hypothesis : Proportion of traffic accidents is same for each day of the…
Q: According to Bayes' Theorem, the probability of event A, given that event B has occurred, is as…
A: P(A)=5/6, P(B|A)=1/7, P(B| A')=1/2, P(A')=1/6
Q: Suppose that a single card is selected from a standard 52-card deck. What is the probability that…
A: There are 52 cards in a deck so the total number of outcomes is 52
Q: A certain forum reported that in a survey of 200 American adults, 29% said they believed in…
A: The formula for the confidence interval for the proportion is,
Q: The random variable X follows a Poisson process with the given value of λ and t. Assuming λ= 0.13…
A: A random variable X follows a poisson process with given value of and t ,Assuming =0.13 and t=15
Q: For each of the following, show how you would code dummy (indicator) variables to include in a…
A: Here, the dummy variable takes only two values 0 or 1. So we need to code the dummy variable with 0…
Q: A particular telephone number is used to receive both voice calls and fax messages. Suppose that 25%…
A: As per our guidelines, we can solve the first three sub parts of question and rest can be…
Q: о O O O Popular Instagram accounts tend to be younger individuals. The mode would be a reasonable…
A: The given histogram represents the distrbution of the age of individuals with more than 10000…
Q: A manufacturing company has developed a machine for cleaning carpet that is fuel-efficient because…
A: Probability density also called as distribution function which represents the density of a…
Q: How many 7 digit phone number are possible? Assume the first digit can be zero and all digits can be…
A: make 7 digit phone number.The first number can be zero and all digits can repeated. The digits are :…
Q: (c) Would it be unusual if 75 of the 150 adults surveyed believe that the overall state of moral…
A: Given thatx = 75n = 150
Q: A nurse measured the blood pressure of each person who visited her clinic. Following is a frequency…
A: A nurse measured the blood pressure of each person who visited her clinic.The following frequency…
Q: 128 patients with advanced lung cancer were followed until death. The four "cell" types of lung…
A: Given the box plot of types of cancers and wanted to comment on distribution type.
Q: A researcher is interested in finding a 98% confidence interval for the mean number minutes students…
A: From the provided information,Confidence level = 98%
Q: In a recent poll, 590 people were asked if they liked dogs, and 28% said they did. Find the Margin…
A: From the given information ,sample size, n = 590 Sample proportion , = 28% = 0.28 Using Formula , (…
Q: Answer true or false. If false, explain briefly. a) Some of the residuals from a least squares…
A: residuals : residuals are the difference between observed value (actual) and predicted value.suppose…
Q: Batch Testing: Determine the probability of a negative result for each combination in the table. n=5…
A: For the green-shaded portion of the problem:The number of independent trials is .The Probability of…
Q: A standardized exam consists of three parts: math, writing, and critical reading. Sample data…
A: The data…
Q: The General Social Survey is completed by adults living in the United States. In 2016 and 2018,…
A: Number of persons living in united states in 2016n1=1008number of persons not living with both of…
Q: How do you solce part d?
A: Let, X= the number of incoming calls involving a fax messages among 25 incoming calls. This…
Q: Simple Random Samples Instructions: Use the random number table and the situation given to select a…
A: Given the random number table.The first number is 46 the first random number.Then going from left to…
Q: Assume that a sample is used to estimate a population proportion p. Find the 95% confidence interval…
A: From the provided information,Confidence level = 95%
Q: In a survey of U.S. adults with a sample size of 2097, 398 said Franklin Roosevelt was the best…
A: Total = 2097, Franklin Roosevelt was best president sinc world war II = 398
Q: (f) Using the binomial distribution, the probability that between 9 and 11 flights, inclusive, are…
A:
Q: Babies: According to a recent report, a sample of 240 one-year-old baby boys in the United States…
A: n=240,x¯=25.5,σ=5.2C.I=99.8%=0.998α=1−C.I=1−0.998=0.002
Q: Determine the outstanding principal of the given mortgage. HINT [See Example 7.] (Assume monthly…
A: loan amount =PV= $100000interest rate = 4.5%period = 33 yearsmonthly interest rate = Number of…
Q: Suppose that we have 5 coins such that if the ith coin is flipped, heads will appear with…
A: We are given coins such that if the coin is flipped, the heads will appear with probability, .
Q: Suppose that a recent poll found that 46% of adults believe that the overall state of moral values…
A: Suppose a random variable X, defines the number of adults who believe that the overall state of…
Q: A survey was conducted in the United States and 10 countries of Western Europe to determine the…
A: Given the data between marijuana use and other drug use. We have to find the correlation coefficient…
Q: An educational software company wanted to see if students improved their entrepreneurial skills…
A: Here want to test if the students improve their entrepreneurship skills after participating in five…
Q: The times in (minutes) taken to complete a 200 metre run by 40 students during their training…
A: ClassFcf20-30020230-40091140-50152650-60113760-700340n=40
Q: A study was done using a treatment group and a placebo group. The results are shown in the table.…
A: The question is about hypothesis testing and confidence interval.Given :Randomly selected no. of…
Q: Grace and colleagues studied the population history of termite colonies. They noted an initial…
A: It is required to find the best fitting power regression that fits the data, obtain the square of…
Q: The probability that the sum of the rolled dice is 8 given that one of the dice is a 3?
A: let's consider the different ways you can get a sum of 8 with two dice:(3, 5) or (5, 3)(2, 6) or (6,…
Q: The data below shows the square feet of living space and the selling price of 12 residential…
A: N = 12 (X) : {1360,1940,1750,1550,1790,1750,2230,1600,1450,1870,2210,1480 } Mx = (1360 +…
Q: It is known that the average American spends $121 per month on eating out. Which of the following…
A: The given data is as follows:Population mean,
Q: (a) P(king or jack) = (Type an integer or a decimal rounded to three decimal places as needed.) (b)…
A: We know thatThere are 52 cards in the deck divided into two colour i.e red(26) and black (26). These…
Q: We wish to estimate what percent of adult residents in a certain county are parents. Out of 200…
A: n=200x=86Sample proportion The level of significance is 0.10 (=1–0.90). Using Excel formula…
Compare California's adjusted rate with that of Florida. Use information in the table provided.

Step by step
Solved in 3 steps with 6 images

- Tax Table Here are selected entries from the 2014 tax table that show the federal income tax owed by those married and filing jointly. The taxable income and the tax are both in dollars. Taxable income Tax 72, 000 9896 72, 200 9926 72, 400 9956 72, 600 9986 72, 800 10, 016 73, 000 10, 046 73, 200 10, 076 73, 400 10, 106 73, 600 10, 136 73, 800 10, 169 74, 000 10, 219 74, 200 10, 269 Over what two parts of this table is the tax a linear function of the taxable income? Find formulas for both linear functions, and explain in practical terms what the slopes mean.Income($1000s) HouseholdSize AmountCharged ($) 54 3 4,016 30 2 3,159 32 4 5,100 50 5 4,742 31 2 1,864 55 2 4,070 37 1 2,731 40 2 3,348 66 4 4,764 51 3 4,110 25 3 4,208 48 4 4,219 27 1 2,477 33 2 2,514 65 3 4,214 63 4 4,965 42 6 4,412 21 2 2,448 44 1 2,995 37 5 4,171 62 6 5,678 21 3 3,623 55 7 5,301 42 2 3,020 41 7 4,828 54 6 5,573 30 1 2,583 48 2 3,866 34 5 3,586 67 4 5,037 50 2 3,605 67 5 5,345 55 6…Price Age Mileage13590 6 6148513775 6 5434422991 1 824615303 4 2485616388 3 2210016600 3 2370216987 4 4740118489 2 1688818859 3 3538019857 3 2963411877 9 5579214989 3 4618315900 3 3700916500 4 455219440 9 8690212988 5 7724115777 6 5964710490 9 932418938 10 4822111988 8 42408 The accompanying table shows a portion of data consisting of the price, the age, and the mileage for 20 used sedans. Price Age Mileage 13590 6 61485 13775 6 54344 ⋮ ⋮ ⋮ 11988 8 42408 Determine the sample regression equation that enables us to predict the price of a sedan on the basis of its age and mileage. (Negative values should be indicated by a minus sign. Round your answers to 2 decimal places.) [If you are using R to obtain the output, then first enter the following command at the prompt: options(scipen=10). This will ensure that the output is not in scientific…
- Price_($000)/Sq Ft 1/Sq Ft Location 14.0542 0.0653 0 17.2907 0.0524 0 18.3029 0.00649 0 15.7341 0.04374 0 14.8521 0.01913 0 15.3572 0.0197 0 18.3278 0.01583 0 15.8483 0.41563 0 17.392 0.29976 0 15.8826 0.1798 0 15.5492 0.00816 0 14.619 0.0325 0 15.7633 0.21829 0 15.1289 0.015939 0 17.2874 0.18765 0 15.6938 0.00986 0 15.3672 0.03096 0 15.3126 0.01917 0 17.4008 0.06055 0 16.1066 0.0611 0 16.6637 0.1171 1 16.5504 0.05552 1 17.0575 0.00657 1 17.9466 0.1407 1 17.8913 0.0648 1 15.5396 0.03339 1 18.6629 0.03443 1 18.0774 0.019 1 20.8122 0.20162 1 18.3237 0.319 1Calories Alcohol% Carbohydrates218 6.5 19.770 0.4 13.3192 6.0 13.155 2.4 1.9215 7.5 19.864 2.8 2.4220 8.0 14.6114 3.8 8.3222 8.1 16.0110 3.9 8.394 4.1 2.695 4.1 2.695 4.1 3.2103 4.1 5.0103 4.1 5.5110 4.1 7124 4.1 9.7222 8.1 16.0110 4.1 7.4269 8.7 18.6105 4.2 5.7330 9.6 32.195 4.2 3.2292 10.5 15.096 4.2 3.2314 10.5 18.9174 6.1 11.1179 6.4 10.6181 6.5 10.6188 6.5 12.7200 6.6 17215 6.7 19.3214 6.8 19.4231 6.9 20200 7.0 18Cost of Materials 78713 42774 27222 37040 12030 13674 19130 33521 19612 5557 163 314 2622 4219 5357 1061 707 10421 4140 7125 8994 5504 716 8926 11121 2283 364 1813 71 1321 12376 9661 19285 18632 2170 7290 8135 12980 4011 5101 3755 2694 3279 20596 10604 24634 28963 8483 6940 8863 2823 29572 3811 1047 2055 1098 11298 34596 27187 19932 9849 46935 11130 13085 132880 6182 4446 7091 496 3805 7195 57264 1865 163 1682 85 395 255 177 943 3527 4254 2282 1387 1183 17010 565 5432 45696 6913 11184 5735 31892 4696 2790 9364 8720 3527 31527 4909 21531 6232 1689 19273 12954 11858 23474 14343 16515 18543 60857 21819 13897 5523 12657 12578 11065 7621 29591 44486 13398 223639 42367 7760 4363 1674 8120 5476 8760 18028 16787 1020 8114 382 3646 506 6604 1789 997 8530 Value Added by Mfg. 23518 15724 24506 21667 20712 12640 4258 35210 20548 23442 287 1508 624 2471 4307 673 817 8986 3145 4076 3806 4276 1239 9423 11045 1916 599 2063 34 1445 10603 5775 10404 13274 1909 4606 5518 12464 5447 2290 4182 2818 2201…
- Score GPA Hours Absences Gender78 3.15 3.0 4 Female75 2.71 4.0 1 Female79 3.57 3.5 2 Male85 3.26 6.5 0 Female85 3.75 2.0 0 Female84 3.20 4.5 3 Female85 3.16 5.0 3 Male80 3.35 1.5 0 Female74 2.75 3.5 6 Male81 3.04 6.5 1 Male76 2.53 3.0 0 Female85 2.92 6.0 1 MaleBoats (tens of thousands) Manatees 7171 5353 7171 3939 6969 3434 6969 4949 7272 4040 7272 6161 7373 5353 7878 6565 8181 8484 8484 8080 9393 8282 9595 9797 9393 7171 9696 6767 9797 8181 9797 9292 101101 7272 9696 8888 9898 9595 9090 8383 8787 8888 9090 8383 8787 7373 8787 6969 Use the accompanying paired data consisting of registered boats (tens of thousands) and manatee fatalities from boat encounters. Let x represent the number of registered boats and let y represent the corresponding number of manatee deaths. Use the given number of registered boats and the given confidence level to construct a prediction interval estimate of manatee deaths. Use xequals=8888 (for 88880,000 registered boats) with a 9999% confidence level.…Annual sales, in millions of dollars, for 21 pharmaceutical companies follow.8408 1374 1872 8879 2459 11413608 14138 6452 1850 2818 135610498 7478 4019 4341 739 21273653 5794 8305a. Provide a five-number summary
- Incomes 29109 21546 30417 10104 19279 27578 23581 26949 35423 12971 37895 31308 28256 31494 31552 34440 33347 26768 25225 29250 23437 31921 19869 31693 38974 34767 33131 23815 26714 36735 33136 34007 39674 22759 27323 28875 37991 23100 29289 21065 20760 25332 28665 21338 33246 27501 1327 39562 30752 21887 32228 10133 25943 38223 38362 27569 38213 25181 29607 29690 27114 27497 36364 35330 45575 33222 15717 21607 28861 22407 11334 18836 13190 26210 14940 48983 21182 29351 27038 19260 32626 31240 13790 23167 19559 53556 21745 24758 20145 37975 22640 28622 24653 25567 19951 11195 30646 25490 17034 31027 32939 26919 27831 23640 20727 23450 17718 37815 27443 26913 27273 34833 27059 36773 10541 36607 22582 24738 31808 45441 36924 17833 24812 27882…Incomes 29109 21546 30417 10104 19279 27578 23581 26949 35423 12971 37895 31308 28256 31494 31552 34440 33347 26768 25225 29250 23437 31921 19869 31693 38974 34767 33131 23815 26714 36735 33136 34007 39674 22759 27323 28875 37991 23100 29289 21065 20760 25332 28665 21338 33246 27501 1327 39562 30752 21887 32228 10133 25943 38223 38362 27569 38213 25181 29607 29690 27114 27497 36364 35330 45575 33222 15717 21607 28861 22407 11334 18836 13190 26210 14940 48983 21182 29351 27038 19260 32626 31240 13790 23167 19559 53556 21745 24758 20145 37975 22640 28622 24653 25567 19951 11195 30646 25490 17034 31027 32939 26919 27831 23640 20727 23450 17718 37815 27443 26913 27273 34833 27059 36773 10541 36607 22582 24738 31808 45441 36924 17833 24812 27882…year Income ($) B P1994 6036 85.1 20.41995 6113 87.8 20.21996 6271 88.9 21.31997 6378 94.5 19.91998 6727 99.9 181999 7027 99.5 19.92000 7280 104.2 22.22001 7513 106.5 22.32002 7728 109.7 23.42003 7891 110.8 26.22004 8134 113.7 27.12005 8322 113 292006 8562 116 33.52007 9042 108.7 42.82008 8867 115.4 35.62009 8944 118.9 32.22010 9175 127.4 33.72011 9381 123.5 34.42012 9735 117.9 48.52013 9829 105.4 66.12014 9722 103.2 62.42015 9769 104.2 58.62016 9725 103.7 56.72017 9930 105.7 55.52018 10419 105.5 57.32019 10625 106.5 53.72020 10905 107.3 52.6 Make a forecast of Mr. X's Income for the next five years Make forecast of income for the given values of B =110 and P = 55
