Compare the performance of both companies with each other, for each of the calculated indicators and determine if it is necessary to make any adjustment or adjustments to better position the firm with the lowest performance, facing the end of the next fiscal year. Explain what adjustments you propose and why.
Compare the performance of both companies with each other, for each of the calculated indicators and determine if it is necessary to make any adjustment or adjustments to better position the firm with the lowest performance, facing the end of the next fiscal year. Explain what adjustments you propose and why.

College Accounting, Chapters 1-27 (New in Accounting from Heintz and Parry)
22nd Edition
ISBN:9781305666160
Author:James A. Heintz, Robert W. Parry
Publisher:James A. Heintz, Robert W. Parry
Chapter15: Financial Statements And Year-end Accounting For A Merchandising Business
Section: Chapter Questions
Problem 4CE

Related questions
Question
Compare the performance of both companies with each other, for each of the calculated indicators and determine if it is necessary to make any adjustment or adjustments to better position the firm with the lowest performance, facing the end of the next fiscal year. Explain what adjustments you propose and why.
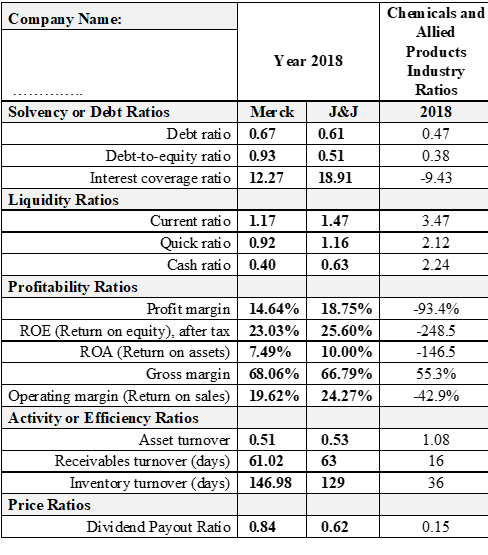
Transcribed Image Text:Chemicals and
Company Name:
Allied
Products
Y ear 2018
Industry
Ratios
Solvency or Debt Ratios
Merck
J&J
2018
Debt ratio 0.67
Debt-to-equity ratio 0.93
0.61
0.47
0.51
0.38
Interest coverage ratio 12.27
18.91
-9.43
Liquidity Ratios
Current ratio 1.17
Quick ratio 0.92
Cash ratio 0.40
1.47
3.47
1.16
2.12
0.63
2.24
Profitability Ratios
Profit margin 14.64% 18.75%
-93.4%
ROE (Return on equity), after tax
23.03%
25.60%
-248.5
ROA (Return on assets) 7.49%
10.00%
-146.5
Gross margin 68.06% 66.79%
Oper ating margin (Return on sales) 19.62% 24.27%
55.3%
42.9%
Activity or Efficiency Ratios
Asset turnover 0.51
Receivables turnover (days) 61.02
0.53
1.08
63
16
Inventory turnover (days) 146.98
129
36
Price Ratios
Dividend Payout Ratio 0.84
0.62
0.15
Expert Solution
This question has been solved!
Explore an expertly crafted, step-by-step solution for a thorough understanding of key concepts.

This is a popular solution!

Trending now
This is a popular solution!

Step by step
Solved in 3 steps

Knowledge Booster


Learn more about
Need a deep-dive on the concept behind this application? Look no further. Learn more about this topic, finance and related others by exploring similar questions and additional content below.Recommended textbooks for you
College Accounting, Chapters 1-27 (New in Account…
Accounting
ISBN:
9781305666160
Author:
James A. Heintz, Robert W. Parry
Publisher:
Cengage Learning

Cornerstones of Financial Accounting
Accounting
ISBN:
9781337690881
Author:
Jay Rich, Jeff Jones
Publisher:
Cengage Learning
College Accounting, Chapters 1-27 (New in Account…
Accounting
ISBN:
9781305666160
Author:
James A. Heintz, Robert W. Parry
Publisher:
Cengage Learning
Cornerstones of Financial Accounting
Accounting
ISBN:
9781337690881
Author:
Jay Rich, Jeff Jones
Publisher:
Cengage Learning