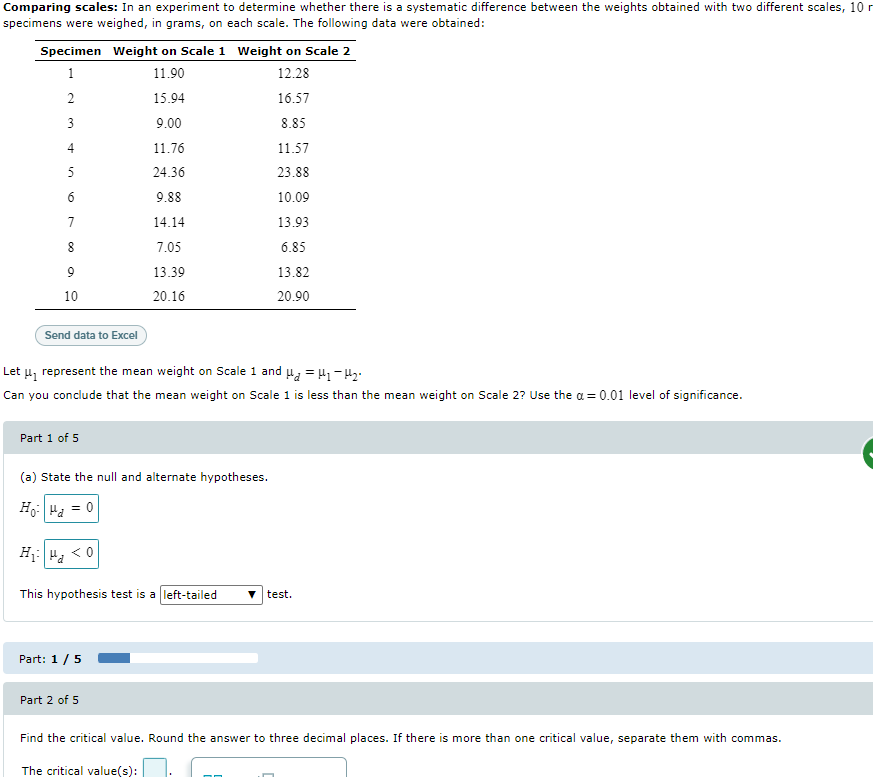
Comparing scales: In an experiment to determine whether there is a systematic difference between the weights obtained with two different scales, 10 specimens were weighed, in grams, on each scale. The following data were obtained:
Q: If 64 applications are randomly selected, what is the probability that the mean credit rating of…
A: Let M denote the mean credit ratimg of sample of size n = 64. Then M follows N(mean = 200, SD =…
Q: The critical value "t" corresponding to the 85th percentile with df = 19* Your answer The critical…
A: Given that
Q: Use the intermediate value theorem to prove that any polynomial function of odd degree with real…
A: Intermediate Value theorem: If f is a function which is continuous at every point of the interval…
Q: What is the probability a randomly selected employee from the table will have an advanced degree and…
A: It is given that Total = 472 Number of employees who have an advanced degree and will make over…
Q: . Which group do you think has the larger standard deviation? OA. The Africa group should have the…
A: Given Information: No. of population=2 Name of the populations: 1. European Country.…
Q: The following are regression Results for Monthly Cash Flow Study Coefficients Standard Error…
A: Solution: The output for the time series model is given.
Q: A student graduated from a 4 -year college with an outstanding loan of $9563 where the average debt…
A:
Q: You may need to use the appropriate appendix table or technology to answer this question. In 2012,…
A: We have given thatn = 370p̂ = 0.76p = 0.70α = 0.05
Q: a. Determine the null and alternative hypotheses. b. Specify the level of significance as a decimal.…
A: here from given information population standard deviation = 3.2 sample mean = 12.1 n = 22…
Q: Can you predict the temperature based on the number of chirps of a cricket? The data below represent…
A: Given information: Chirps/15 sec (x) Temp (y) 20 89 16 72 20 93 18 84 17 81 16…
Q: 1. Survey tests on leadership skills and on self-concept were administered to student-leaders. Both…
A: Here one independent and one dependent variable. This is simple linear regression model. We have to…
Q: Find the complement of each of the given probabilities: The complement of P(A) = 73%: = %…
A: As per our guidelines we can solve first three sub part of question and rest can be reposted…
Q: In a survey, 95% of n = 400 randomly sampled married men said that they would marry their spouses…
A: For men, = 0.95 * 400 = 380 men were ready to marry there spouses again.
Q: 1
A: Given thatAccording to Malthus, with diminishing average product of labour in production and…
Q: Question: 2. In order to determine the average weight of carry-on luggage by passengers in airp…
A:
Q: The table contains data on the admission price (in dollars) for one-day tickets to 10 theme parks in…
A: Arrange the given data in ascending order28, 40, 42, 42, 44, 44, 48, 55, 61, 64sample size(n)=10
Q: What is the standardized test statistic for the significance test the school administrator wants to…
A: It is given that Sample size n = 10 Sample mean M = 27.5 Sample SD s = 3.85 Population mean = 25
Q: Who will win this Adwords auction? SARA KYLIE KENDY PAUL MAX BID 2 1 3 5 QUALITY SCORE MEDIUM LOW…
A: Winning the auction in adwords is based on the amount used for the bid with number of times they…
Q: An electrical company claims that an average life of bulbs it manufactures is 1200 hours with a…
A: Given that : μ= 1200 hour ? = 250 hours n = 100 By using the central limit theorem we solve this…
Q: Is there a relationship between a college student’s GPA and the number of hours that student works…
A: The independent variable is number of hours worked per week. The dependent variable is GPA. We have…
Q: Example 20.21 Assuming that all the products can be assigned equal weights, calculate the chain-base…
A:
Q: Assume that a sample is used to estimate a population proportion p. Find the 99% confidence interval…
A:
Q: Find out the mean number of breakdowns per week for this machine.
A: here give distribution of x = no of breakdown of machine in week
Q: 15. Bonus +3 What is its standard deviation? A. 2.3 E. other B. 22 C. 4.4 D. 2.1
A: ( 5 ) Sample Standard deviation S= ?
Q: The Toylot company makes an electric train with a motor that it claims will draw an average of no…
A: We have given thatMean(µ) = 0.8Sample size (n) = 9Sample mean (x̅) = 1.32Standard deviations (s) =…
Q: Example 9.22 Suppose we are interested in knowing the probability of getting at least 15 replies to…
A:
Q: The national average for mathematics on a standardized test in 2011 was 518. Suppose that the…
A: Solution-: Given: μ=518,σ=49 We want to find what boundaries would you expect 99.7% of the scores to…
Q: The following are the heights of four students in centimeters. Suppose samples of size 2 are taken…
A: Let all possible random samples of the same size are considered that have been drawn from the same…
Q: 9. X is a normally distributed random variable with unknown µ and an unknown variance, o². X and s²…
A:
Q: Healthy men aged 21–35 were randomly assigned to one of two groups: half received 0.82 gram of…
A: Confidence interval has two limits they are upper and lower limit. It has interval range where the…
Q: 3. Find the critical value (or values) for the t test for each. a. n = 10, a = 0.05, right-tailed b.…
A:
Q: Age of person (in years) Weight (in kg) a. 11 12 13 14 15 16 17 40 42 38 35 45 51 48 b. Trend Line :…
A: For the given data Draw scatter plot ,trend line and direction of correlation
Q: You may need to use the appropriate appendix table or technology to answer this question. Consider…
A: Given the null and alternative hypothesis of a proportion test. We have to perform the test in parts…
Q: Suppose that you are offered the following "deal." You roll a six sided die. If you roll a 6, you…
A: Suppose that you are offered the following "deal." You roll a six sided die. If you roll a 6, you…
Q: Two samples are taken with the following sample means, sizes, and standard deviations x¯1 = 27 x¯2…
A: Given n1=65 n2=72 S1=4 S1=5
Q: Until 2002, hormone replacement therapy (HRT), estrogen and/or progesterone, was commonly prescribed…
A:
Q: How strong a force (in pounds) is needed to pull apart pieces of wood 4 inches long and 1.5 inches…
A: The random variable strength follows normal distribution. We have to test whether the wood's mean…
Q: 980 adults to learn about their gym membership. The results showed that 574 of the respondents lack…
A: The random variable X follows normal distribution. We have to construct 95% confidence interval for…
Q: Example 9.15 Let us take another example. The following table shows the number of days in a 50-day…
A:
Q: Stoaches are fictional creatures with distinctive octarine stripes. Unfortunately they are…
A: A hypothesis which is tested for plausible rejection is called the Null Hypothesis (typically…
Q: e, x uency, f mean is 1 2 3 4 5 6 2 2 3 6 4 7 (Round to 3 decimal places as needed.) 7 9 8 3 9 - 10…
A: Given Find the mean for the data items in the given frequency distribution.
Q: Example 12.12 A company has reorganised its sales department. The following data show its weekly…
A:
Q: The average number of strawberries that come in a pint is 27.9, with a standard deviation of 7.8.…
A:
Q: The table contains data on the admission price (in dollars) for one-day tickets to 10 theme parks in…
A: To find the interquartile range (IQR), first find the median (middle value) of the lower and upper…
Q: Prior to graduation, a high school class was surveyed about their plans after high school. The table…
A: For the given data Expected number of female students who are planning to work = ?
Q: 9.33 Une hundred car stereos are inspected as they come off the production line and number of…
A:
Q: 2. Age of car (in years) Mileage, (in km/liter) 0.5 16 1 15 1.5 10 2 3 4 12 10 12 4.5 11 a. b. Trend…
A: Regression line can be represented using the scatter plot. It has two regression coefficients, they…
Q: In a study of the effects of mood on evaluation of nutritious food, 208 subjects were randomly…
A: Given: n1=104n2=104x¯1=4.25x¯2=5.65s1=2.05s2=1.75 X follows 2 sample pooled T test.
Q: What correlation can be observed between x and y in the given figure? ho .. 0 -2 Strong positive…
A: Scatterplot is a graphical representation between two variables, where each of the points of the…
Q: consider a political discussion group of 6 democrats, 5 republicans, and 3 independents. If two…
A: Given that consider a political discussion group of 6 democrats, 5 republicans, and 3 independents.…
Step by step
Solved in 4 steps