complete e and f however he didn't do it attached is what he did to solve e) please explain to me how to solve e) , f) , g).
complete e and f however he didn't do it attached is what he did to solve e) please explain to me how to solve e) , f) , g).

Glencoe Algebra 1, Student Edition, 9780079039897, 0079039898, 2018
18th Edition
ISBN:9780079039897
Author:Carter
Publisher:Carter
Chapter10: Statistics
Section10.6: Summarizing Categorical Data
Problem 24PPS

Related questions
Topic Video
Question
Hello
I asked your colleague to complete e and f however he didn't do it attached is what he did to solve e) please explain to me how to solve e) , f) , g).
with explanation on what your doing and why
Thank you
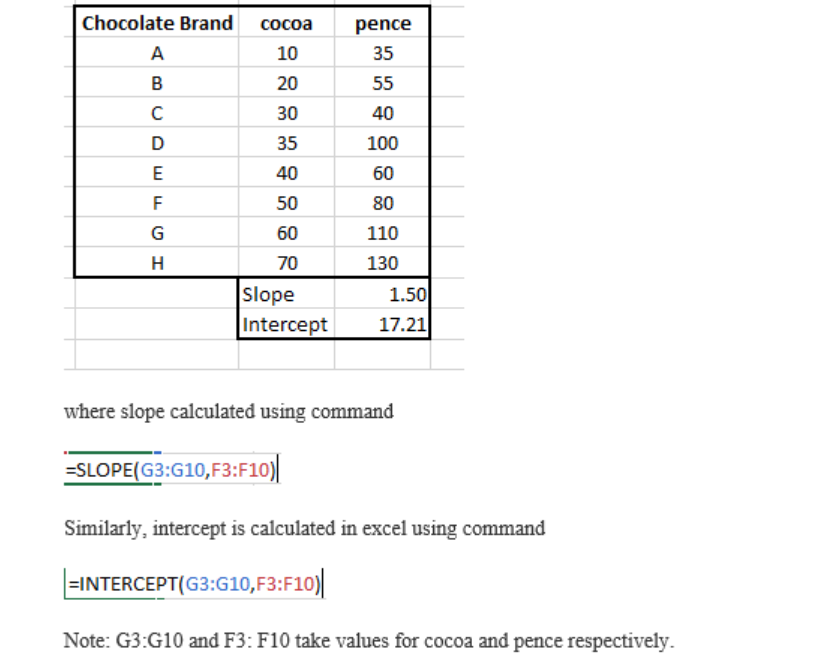
Transcribed Image Text:Chocolate Brand
сосоа
pence
A
10
35
в
20
55
30
40
D
35
100
E
40
60
F
50
80
G
60
110
H
70
130
1.50
17.21
Slope
Intercept
where slope calculated using command
=SLOPE(G3:G10,F3:F10)|
Similarly, intercept is calculated in excel using command
|=INTERCEPT(G3:G10,F3:F10)|
Note: G3:G10 and F3: F10 take values for cocoa and pence respectively.
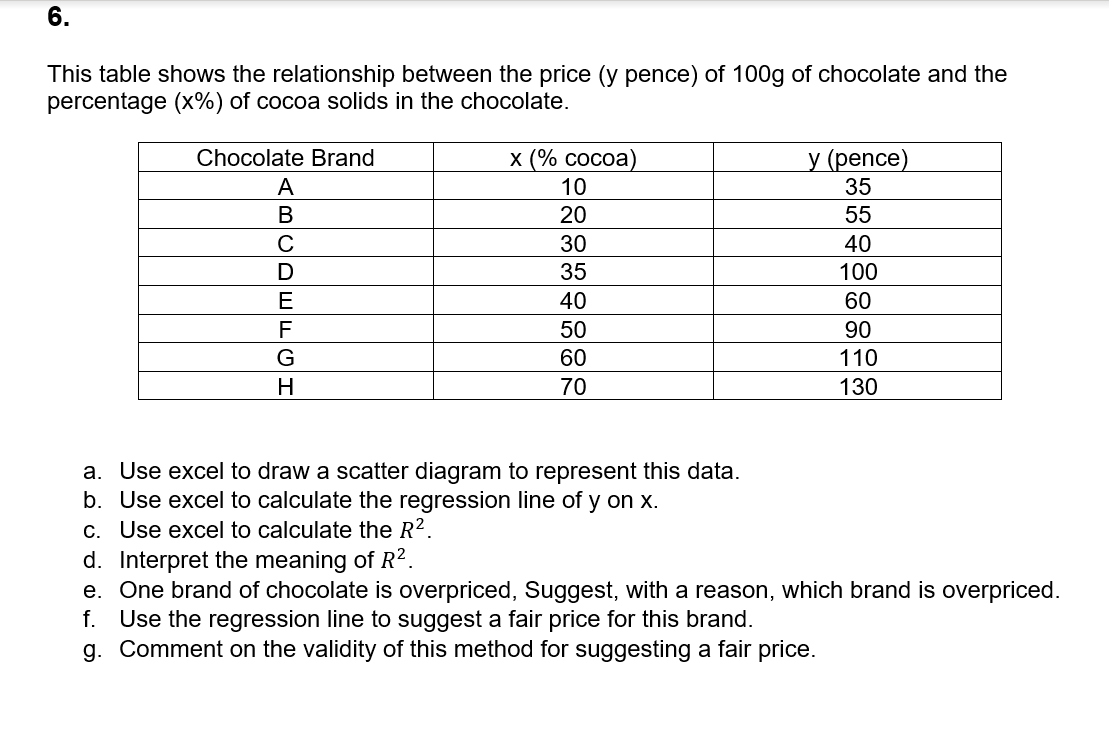
Transcribed Image Text:6.
This table shows the relationship between the price (y pence) of 100g of chocolate and the
percentage (x%) of cocoa solids in the chocolate.
Chocolate Brand
x (% сосоа)
у (pence)
A
10
35
20
55
C
30
40
D
35
100
E
40
60
F
50
90
60
110
H
70
130
a. Use excel to draw a scatter diagram to represent this data.
b. Use excel to calculate the regression line of y on x.
c. Use excel to calculate the R².
d. Interpret the meaning of R².
e. One brand of chocolate is overpriced, Suggest, with a reason, which brand is overpriced.
f. Use the regression line to suggest a fair price for this brand.
g. Comment on the validity of this method for suggesting a fair price.
Expert Solution
This question has been solved!
Explore an expertly crafted, step-by-step solution for a thorough understanding of key concepts.

Step by step
Solved in 4 steps with 2 images

Knowledge Booster


Learn more about
Need a deep-dive on the concept behind this application? Look no further. Learn more about this topic, statistics and related others by exploring similar questions and additional content below.Recommended textbooks for you
Glencoe Algebra 1, Student Edition, 9780079039897…
Algebra
ISBN:
9780079039897
Author:
Carter
Publisher:
McGraw Hill

Big Ideas Math A Bridge To Success Algebra 1: Stu…
Algebra
ISBN:
9781680331141
Author:
HOUGHTON MIFFLIN HARCOURT
Publisher:
Houghton Mifflin Harcourt

Holt Mcdougal Larson Pre-algebra: Student Edition…
Algebra
ISBN:
9780547587776
Author:
HOLT MCDOUGAL
Publisher:
HOLT MCDOUGAL
Glencoe Algebra 1, Student Edition, 9780079039897…
Algebra
ISBN:
9780079039897
Author:
Carter
Publisher:
McGraw Hill
Big Ideas Math A Bridge To Success Algebra 1: Stu…
Algebra
ISBN:
9781680331141
Author:
HOUGHTON MIFFLIN HARCOURT
Publisher:
Houghton Mifflin Harcourt
Holt Mcdougal Larson Pre-algebra: Student Edition…
Algebra
ISBN:
9780547587776
Author:
HOLT MCDOUGAL
Publisher:
HOLT MCDOUGAL

Functions and Change: A Modeling Approach to Coll…
Algebra
ISBN:
9781337111348
Author:
Bruce Crauder, Benny Evans, Alan Noell
Publisher:
Cengage Learning