Complete the ANOVA summary table below. Mean Square Degrees of Freedom Sum of Source Squares (Variance) Among groups c-1 = SSA = MSA = 32 FSTAT Within groupS SSW = 480 MSW = n-c= Total n-1= SST = (Simplify your answers.)
Complete the ANOVA summary table below. Mean Square Degrees of Freedom Sum of Source Squares (Variance) Among groups c-1 = SSA = MSA = 32 FSTAT Within groupS SSW = 480 MSW = n-c= Total n-1= SST = (Simplify your answers.)

Glencoe Algebra 1, Student Edition, 9780079039897, 0079039898, 2018
18th Edition
ISBN:9780079039897
Author:Carter
Publisher:Carter
Chapter10: Statistics
Section10.5: Comparing Sets Of Data
Problem 29PFA

Related questions
Question
Transcribed Image Text:Degrees of Sum of
Source Freedom Squares
Mean Square
(Variance)
F
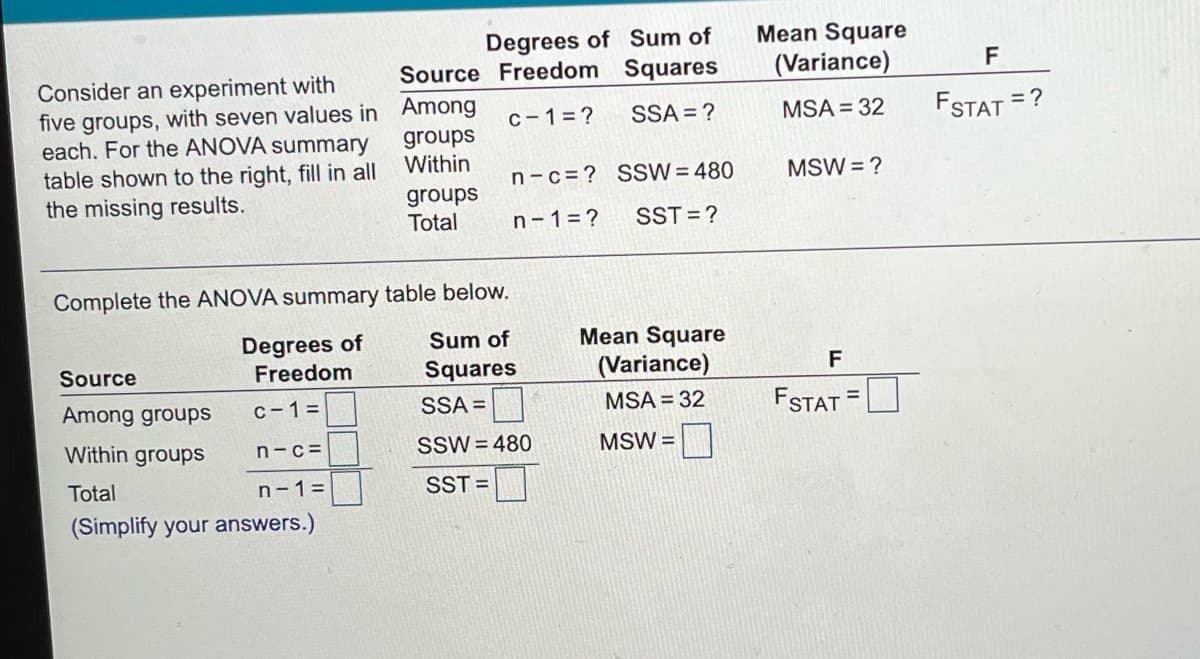
Consider an experiment with
five groups, with seven values in Among
each. For the ANOVA summary
table shown to the right, fill in all
the missing results.
c-1= ?
SSA = ?
FSTAT =?
MSA = 32
groups
Within
n-c=? SSW = 480
MSW = ?
groups
Total
n-1=?
SST =?
Complete the ANOVA summary table below.
Degrees of
Freedom
Mean Square
(Variance)
Sum of
Source
Squares
F
Among groups
C-1=
SSA =
MSA = 32
FSTAT =
Within groups
SSW = 480
MSW =
n-c=
Total
n-1=
SST =
(Simplify your answers.)
Expert Solution
This question has been solved!
Explore an expertly crafted, step-by-step solution for a thorough understanding of key concepts.

Step by step
Solved in 2 steps

Recommended textbooks for you
Glencoe Algebra 1, Student Edition, 9780079039897…
Algebra
ISBN:
9780079039897
Author:
Carter
Publisher:
McGraw Hill
Glencoe Algebra 1, Student Edition, 9780079039897…
Algebra
ISBN:
9780079039897
Author:
Carter
Publisher:
McGraw Hill