Complete the following paragraph by selecting words or phrases from the list that follows it to fill in the underlined gaps. In a long sequence of repetitions of a study or experiment, random samples tend to settle down towards probability distributions in the sense that for discrete data, bar charts settle down towards probability functions, and for histograms settle down towards continuous data, probability. functions. As the sample size increases, the amount of difference between successive graphical displays obtained from the data Available words and phrases: cumulative continuous frequency relative frequency decreases mass remains constant increases density discrete models model unimodal unit-area
Complete the following paragraph by selecting words or phrases from the list that follows it to fill in the underlined gaps. In a long sequence of repetitions of a study or experiment, random samples tend to settle down towards probability distributions in the sense that for discrete data, bar charts settle down towards probability functions, and for histograms settle down towards continuous data, probability. functions. As the sample size increases, the amount of difference between successive graphical displays obtained from the data Available words and phrases: cumulative continuous frequency relative frequency decreases mass remains constant increases density discrete models model unimodal unit-area

Chapter8: Sequences, Series,and Probability
Section8.7: Probability
Problem 11ECP: A manufacturer has determined that a machine averages one faulty unit for every 500 it produces....

Related questions
Question
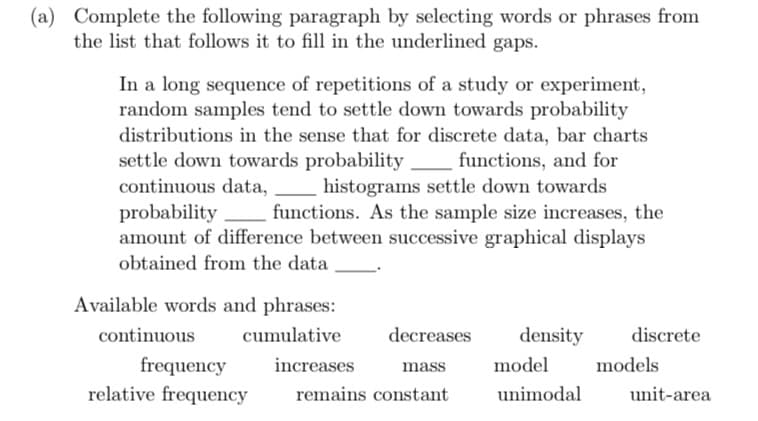
Transcribed Image Text:(a) Complete the following paragraph by selecting words or phrases from
the list that follows it to fill in the underlined gaps.
In a long sequence of repetitions of a study or experiment,
random samples tend to settle down towards probability
distributions in the sense that for discrete data, bar charts
settle down towards probability functions, and for
continuous data,
histograms settle down towards
probability functions. As the sample size increases, the
amount of difference between successive graphical displays
obtained from the data
Available words and phrases:
cumulative
continuous
frequency
relative frequency
decreases
mass
remains constant
increases
density discrete
model
unimodal
models
unit-area
Expert Solution
This question has been solved!
Explore an expertly crafted, step-by-step solution for a thorough understanding of key concepts.

Step by step
Solved in 2 steps

Recommended textbooks for you