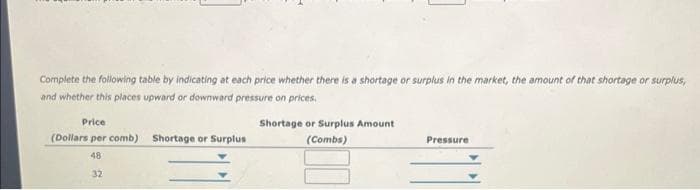
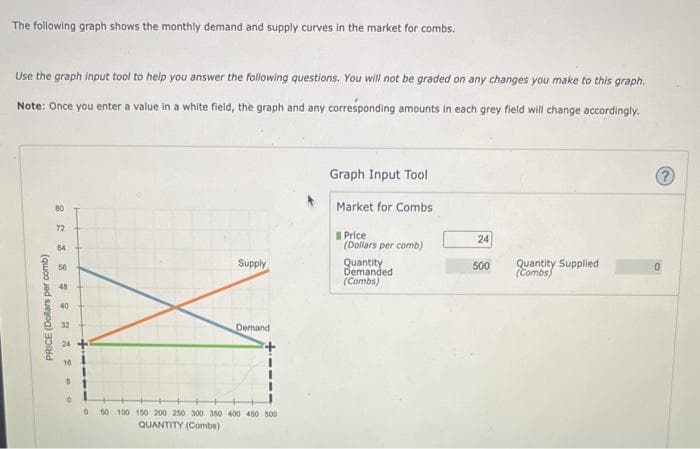
Complete the following table by indicating at each price whether there is a shortage or surplus in the market, the amount of that shortage or surplus, and whether this places upward or downward pressure on prices. Price (Dollars per comb) Shortage or Surplus 48 32 Shortage or Surplus Amount (Combs) Pressure


Q: 4. Explain the Following: a) Privatization b) Legacy Debt c) Annuity Payment d) Social Security
A: “Since you have posted multiple questions with multiple sub parts, we will provide the solution only…
Q: ) Four roommates are planning to spend the weekend in their dorm room watching old movies, and they…
A: Disclaimer- “Since you have asked multiple questions, we will solve the first three questions for…
Q: Al Bundy says he paid $25,000 down on a new house and will pay $525 per month for 30 years. If…
A: Present value is the value of investment in today's dollar Future value is the value of investment…
Q: As part of Budget 2018, the Government of Canada introduced the Canada Workers Benefit (CWB) that…
A: As a part of budget 2018, the government of Canada introduced the Canada Workers Benefit (CWB). CWB…
Q: series of alternative projects have the following series of discount annualized costs and benefits.…
A: Project Alternatives A B C D E PV of Benefits 100 160 90 70 180 PV of Costs 60 90 40 30 120
Q: Question 3 Judge Mark Griffiths finds that Moodle is a relentless and predatory monopolist. Judge…
A: In economics, a monopoly refers to a situation where a single company or entity dominates the market…
Q: The accompanying table shows a car manufacturer’s total cost of producing cars. Quantity of cars TC…
A: Explanation; Fixed cost = cost when output is zero TVC = TC – FC ATC = TC / Qty AFC = FC / Qty AVC…
Q: 4. Min King, the world traveler, says if the airlines want to attract more passengers, they should…
A: Elasticity of demand describes how much a product or service's quantity desired changes in reaction…
Q: Explain a main point in Maki Naro's "Vaccines Work. Here Are the Facts" for rhetorical analysis…
A: The production, distribution, and consumption of healthcare products and services are the main…
Q: The table to the right contains price-demand and total cost data for the production of projectors,…
A: Given data : Q P C 270 592 115000 360 413 120600 520 186 165000 780 56 193000
Q: Question 1 The price of crude oil increased to its highest level due to conditions which impacted…
A: Demand-supply equilibrium: Demand is the aggregate demanded quantity made by all the market…
Q: 2. What is Consumption Smoothing? How does Insurance help people Smooth Consumption?
A: Consumption smoothing refers to the process of maintaining a stable level of consumption over time,…
Q: Brenda's Family Photos is a photographic portrait business in a perfectly competitive market in…
A: The goal of a firm can vary depending on the specific circumstances and objectives of the company.…
Q: Tim Urban, owner/manager of Urban's Motor Court in Key West, is considering outsourcing the daily…
A: The concept of a crossover point is used in comparing the costs/benefits of two alternative ways of…
Q: "M-1" and "M-2" are two of the most well-known measures of the United States' money supply. We need…
A: Money supply refers to the total amount of money in circulation within an economy at a given time.…
Q: university spent $1.3 million to install solar panels atop a parking garage. These panels will have…
A: The marginal cost implies the increment in production costs generated by the production of…
Q: 6. Using the labor market, production function. and AS/AD graphs of the classical model, show the…
A: The supply and demand for labour, wherein employees give the supply and employers provide the…
Q: Derive a bid-rent function for a "typical" firm. Draw a graph of the bid-rent function that is…
A: Bid rent is a concept in urban economics that refers to the maximum amount of money a person or…
Q: Assume a two-sector economy model is given by: Y = C + I, C = 97 + 0.7Y, I = 180 – 125i M s = 255,…
A: LM curve shows the combination of levels of D and S of money and an interest rate at which a money…
Q: 30 L* Output 0 10 20 30 40 50 60 70 The price of labour is $30 per unit and the price of capital is…
A: The production cost of the firm’s output under the circumstances of the long run will be termed as…
Q: Consider an economy with two goods, consumption c and leisure I, and a representative consumer. The…
A: The consumer's preferences over consumption and hours of work can be represented by the utility…
Q: True/False Usually monopoly is inefficient for the consumer.
A: A monopoly is a market structure where a single business or entity is the only provider of a…
Q: Use the following values for the graph above: A 20.00 19.00 $ с 18.00 D 14.00 E 10.00 F 5 G 10 H 30…
A: Consumers surplus is the difference between the highest price a consumer is willing to pay and the…
Q: A firm produces a product in a competitive industry and has a total cost function (TC) of TC(q) =…
A: In short run a competitive firm will produce that level of output where the price (P=MR) is equal to…
Q: In the following question you are asked to determine, other things equal, the effects of a given…
A: A good is said to be normal good , if the income elasticity is positive. The normal good's demand…
Q: For an investment of$800 every 6 months at 6.2%/a compounded semi-annually for 20 years, what is the…
A: To calculate the value of the investment after 20 years, We can use the formula for the future…
Q: Appledale Dairy is considering upgrading an old ice-cream maker. Moderate upgrading costs $7050 now…
A: Present value is the value of investment in today's dollar. Future value is the value of investment…
Q: are debating how many to watch. Here is their willingness to pay for each film: Dwayne First film…
A: Willingness to pay: In economics, the aforementioned expression is related to the purchaser/buyers'…
Q: If you want to withdraw $20,000 at the end of two years and $55,000 at the end of four years, how…
A: Present value (PV) refers to the current value of a future sum of money, based on a certain interest…
Q: If we know that the length of time it takes a college student to find a parking spot in the library…
A: Given that: the length of time it takes a college student to find a parking spot in the library…
Q: Suppose when income increases by $5,000, there is an increase in consumption of $3,000. a. Calculate…
A: The multiplier effect in AD-AS framework: The main idea behind the multiplier effect is that an…
Q: 24 out of the 64 movie goers said that they did not like the movie. This means that 37.50% of the…
A: Data Analysis and Interpretation in Economics refer to the process of collecting, organizing,…
Q: Assume that two collectors, X and Y are in a first prize sealed bid auction for a batch of vintage…
A: In a first-price sealed bid auction, each participant submits a private, sealed bid for an item, and…
Q: = = 4q and k2q. Which 12. Suppose a company has the following contingent demands l of the following…
A: Marginal Cost: it refers to the change in total cost due to 1 additional unit of production. As due…
Q: 1. What Market Failures Justify the Provision of Public Social Insurance?
A: Public social insurance is a system of government programs designed and intended for provide…
Q: 3. Answer the following scenarios for each of the next Non-Price questions. Ja) Last September,…
A: Demand is the market's desire to buy the good or service, whereas supply is the market's capacity to…
Q: Draw the graph. Highlight consumer surplus, producer surplus, and deadweight loss.
A: A measure of the consumer benefits brought about by market competition is called consumer surplus. A…
Q: 2. Saving and investment in the national income accounts The following table contains data for a…
A: Gross Domestic Product (GDP): Gross Domestic Product is described as the total value of goods and…
Q: 1. What is the Civilian Rate in October of 2009? 2. What is the Natural Rate of Unemployment in…
A: One key measure used to assess a country's economic success is the unemployment rate. When adults…
Q: Question 42 Scenario: The following table shows the initial balance sheets of Bank A and the Fed.…
A: Here the bank A have earlier purchased some bonds of FED and whose maturity have came up. And now…
Q: True/ False Competitive market is efficient for the consumer.
A: A market structure that is competitive has many buyers and sellers, but none of them has enough…
Q: a. What is the real per capita GDP for each country in 1970. AGO: Number DMA: Number b. What is the…
A: Given that: real per capita GDP data for the two countries. AGO and DMA are the country codes. (a)…
Q: What are the three stages of the demographic transition? For each stage describe: a. Is population…
A: A population's age distribution can significantly change as a result of a long-term pattern of…
Q: Quebec losing hold over maple syrup industry to U.S. competition The Federation of Quebec Maple…
A: Market structure is significant because it affects direction of the economy through influencing…
Q: The following is cost information for the Creamy Crisp Donut Company. Entrepreneur's potential…
A: Explicit Costs are those costs that are incurred in monetary terms to meet the expenses of a…
Q: Suppose a natural monopoly with diminishing average and marginal costs. Represent graphically: a)…
A: A natural monopoly arises when the long run average cost curve falls over a sufficiently large range…
Q: Nabil is considering buying a house while he is at university. The house costs $200000 today.…
A: The present worth of cash flow refers to its value at present in accordance with its expected value…
Q: Explain why the intergenerational correlation of earnings would likely be higher or lower than…
A: The intergenerational correlation of earnings refers to the extent to which the income or earnings…
Q: Inflation distorts savings when real interest income, rather than nominal interest income, is taxed.…
A: Nominal interest income refers to the income that is earned from interest on borrowings that is not…
Q: Determine a scenario where government imposes a binding restriction on price (ceiling or floor).
A: Price ceilings means through which a good's price is kept from increasing past a specific point. The…


Trending now
This is a popular solution!

Step by step
Solved in 3 steps


- The weekly revenue from the sale of a product is increasing at a rate of \$10$10 per \$1$1 increase in price, and the price is decreasing at a rate of \$0.5$0.5 per additional product sold. What is the marginal weekly revenue with respect to the number of products sold? Interpret your answer and be sure to state the units.Select the correct colored supply and demand graph for iPads that represent the impact of an employee strike at an iPad factory.A commercial fisherman notices the followingrelationship between hours spent fishing and thequantity of fish caught:HoursQuantity of Fish(in pounds)0 hours 0 lb.1 102 183 244 285 30a. What is the marginal product of each hour spentfishing?
- onsider the supply function: Qs = 60 + 5P – 12 PI + 10F , Where Qs = quantity supplied, P = price of the commodity, PI = price of a key input in the production process, and F = number of firms producing the commodity. Interpret the slope parameters on P, PI, and F. Derive the equation for the supply function when PI =$90 and F = 20. Sketch a graph of the supply function in part b. At what price does the supply curve intersect the price axis? Give an interpretation of the price intercept of this supply curve. Using the supply function from part b, calculate the quantity supplied when the price of the commodity is $300 and $500. Derive the inverse of the supply function in part b. using the inverse supply function; calculate the supply price for 680 units of the commodity. Give an interpretation of the supply price.The price of oil is currently over $80 per barrel and has been as high as $90 per barrel after Saudi Arabia and a couple of oter OPEC countries reduced output this year. The demand for oil is expected to increase by 1 million barely per day over the next year according to the International Energy Agency but OPEC+ has been unclear about its intentions of increasing oil supplies. a. If OPEC+ increases its production by million barrels per day, we can unambiguously say that the equilibrium price will fall, and the equilibrium quantity will rise.THIS IS NOT A WRITING ASSIGNMENT! It is a graph. I need help on how to draw the supply and demand graph/diagram in Excel. The estimated supply function for avocados is Q = 58 + 15p − 20pf, where pf is the price of fertilizer. Determine how much the supply curve for avocados shifts if the price of fertilizer rises by $1.10 per lb. Illustrate this shift in a diagram.
- Suppose that the demand and supply curves for good X are: QD = 75 − 1.25P and QS = −60 + 2.50P A: Algebraically solve for the market equilibrium price and quantity, neatly showing your work. B: Neatly construct a graph and plot the demand curve, carefully showing the horizontal andvertical intercepts. On the same graph, neatly plot the supply curve, showing an intercept. Label theequilibrium.The following graph input tool shows the daily demand for hotel rooms at the Oceans Hotel and Casino in Atlantic City, New Jersey. To help the hotel management better understand the market, an economist identified three primary factors that affect the demand for rooms each night. These demand factors, along with the values corresponding to the initial demand curve, are shown in the following table and alongside the graph input tool. Demand FactorInitial ValueAverage American household income$50,000 per yearRoundtrip airfare from Pittsburgh (PIT) to Atlantic City (ACY)$250 per roundtripRoom rate at the Meadows Hotel and Casino, which is near the Oceans$250 per night For each of the following scenarios, begin by assuming that all demand factors are set to their original values and Oceans is charging $100 per room per night. If average household income increases by 20%, from $50,000 to $60,000 per year, the quantity of rooms demanded at the Oceans____ from rooms per night to______rooms…Please calculate the total cost of providing a 50% subsidy on purchases of fruit and vegetables at farmers markets by SNAP participants. Assume that you are estimating it for the state of Connecticut with 350,000 SNAP participants. The season for farmers markets and the use of subsidies is 5 months (May-September); subsidies can only be used during this period. Based on prior studies, you know that a typical SNAP participant that attends farmers markets will purchase on average 3 lb of fruit and 2 lb of vegetables per month. Average price for vegetables is $1.5 per lb and the price elasticity of demand for vegetables among SNAP participants is -0.6. Similarly, fruit cost on average $2.5 per lb and the demand elasticity for fruit is -0.8. How much should the state of Connecticut expect to pay in total subsidies each season if only 20% of SNAP participants will attend farmers markets?
- Explain the impact of the following conditions on the market demand and price of given products and sub-parts aswell: The impact of decrease in income of a household on the market demand and market equilibrium price of an inferior product. The impact of an increase in the price of Yamaha motorcycles on the demand and market price of Honda motorcycles. The impact of Covid-19 on the market demand for hand sanitizer. Note: Just explain justify your answers theoretically. There is no need to provide graphical analysis.Green et al. (2005) estmate the supply and demand curves for Californa processod tomatoes. The supply function is: \[ \ln \left(Q_{s}\right)=0.200+0.550 \ln (p) \] whereQis the quantify of processing tomatoes in milions of tons per year andpis the price in dollars per ton. The demand function is: \[ \ln \left(Q_{d}\right)=2600-0.200 \ln (p)+0.150 \ln \left(p_{1}\right) . \] wherep1is the price of tornato paste (which is what processing tomatoes are used to produce) in dollars per ton. Supposept=$119Determine how the equilerium price and quantity of processing tomatees change if the price of tomato pasise tails by16%. If the price of tomato paste fals by18%, then the equaborium price will by 5 (Enter a numene response using a real number rounded to two decimal places)The annual demand for imported oranges is given by the following equation:QD = 600,000 − 30,000Pwhere P is the price per kilogram and QD is quantity of kilograms demanded per year.The supply of imported oranges is given by the equation:QS = 20,000P Calculate the following: ii. the amount of revenues collected