Complete the following table by indicating whether each point represents output combinations that are inefficient, efficient, or unattainable. Chea that apply. Point Inefficient Efficient Unattainable A
Complete the following table by indicating whether each point represents output combinations that are inefficient, efficient, or unattainable. Chea that apply. Point Inefficient Efficient Unattainable A

Chapter13: General Equilibrium And Welfare
Section: Chapter Questions
Problem 13.4P

Related questions
Question
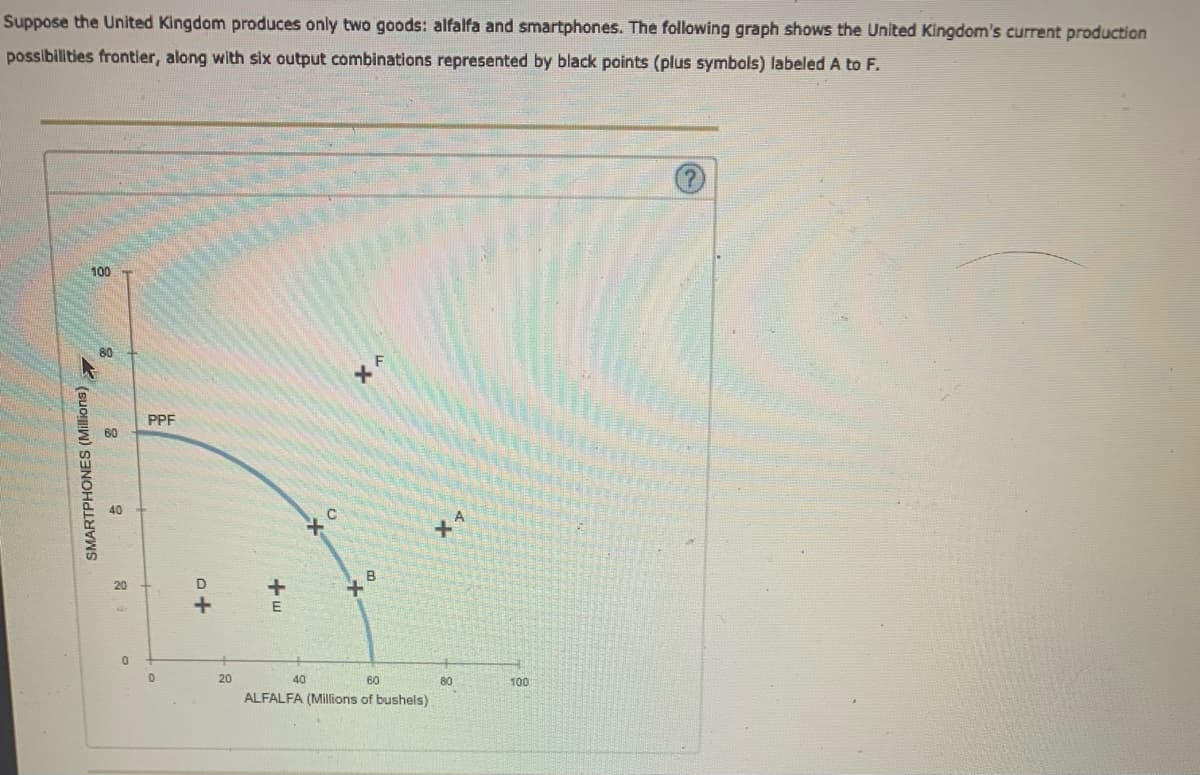
Transcribed Image Text:Suppose the United Kingdom produces only two goods: alfalfa and smartphones. The following graph shows the United Kingdom's current production
possibilities frontier, along with six output combinations represented by black points (plus symbols) labeled A to F.
100
PPF
40
20
D
E
20
40
60
80
100
ALFALFA (Millions of bushels)
SMARTPHONES (Millions) 7

Transcribed Image Text:Complete the following table by indicating whether each point represents output combinations that are inefficient, efficient, or unattainable. Check
that apply.
Point
Inefficient
Efficient
Unattainable
A
C
Expert Solution
This question has been solved!
Explore an expertly crafted, step-by-step solution for a thorough understanding of key concepts.

This is a popular solution!

Trending now
This is a popular solution!

Step by step
Solved in 2 steps with 1 images

Knowledge Booster


Learn more about
Need a deep-dive on the concept behind this application? Look no further. Learn more about this topic, economics and related others by exploring similar questions and additional content below.Recommended textbooks for you