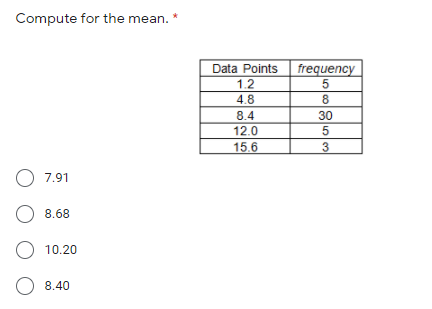
Compute for the mean. * Data Points frequency 5 8 1.2 4.8 8.4 30 12.0 15.6 3 O 7.91 O 8.68 O 10.20 O 8.40


Q: The table below shows the scores of a group of students on a 10-point qui2. Test Score Frequency 3 3…
A: Given:
Q: The file contains the amount that a sample of nine customers spent for lunch ($) at a fast-food…
A:
Q: Given below are the ages of motorcyclists at the time they were fatally injured in traffic…
A: Construct a frequency distribution of grouped scores. 2)
Q: The table below summarizes the number of children per household for a sample of 41 middle-income…
A:
Q: Q. 8. Calculate the mean from the following data: Marks below : 10 20 30 40 50 No. of students : 15…
A:
Q: .ccording to the below table, calculate the weighted mean. Frequency 2 5 Number of Laptops 1 2 3 4 O…
A: For the given data Find Weighted mean = ?
Q: * :For the following distribution calculate the mean, median, lower quartil, node and standard…
A: Descriptive Statistics describes the characteristics of the dataset. Since you have posted a…
Q: Complete the frequency distribution table and then find the standard deviation Repetition Categories…
A: To complete the frequency distribution table and to find the standard deviation: Complete frequency…
Q: Given the frequency table below of the students result in 25 point quiz. Compute its mean.
A: Let x denotes the class mark and f be the frequency. The mean can be calculated as Mean = ∑f.x /∑f
Q: The table below shows the scores of a group of students on a 10-point quiz. Test Score Frequency 3 3…
A:
Q: Find the mean for the given sample data. Unless otherwise specified, round your answer to one more…
A: Frank's furniture employees earned amount in the last week is given . We need to find the mean…
Q: Last year a company received 50 complaints concerning carpet installation. The data in the…
A: Given Information: The data represents the number of days between the receipt of a complaint and the…
Q: Below are the distances travelled (km) by a sample of workers of a call center on their way to work…
A: We create class Intervals according to the minimum observation then count the frequencies for every…
Q: A sample of college students was asked how much they spent monthly on pizza. Approximate the mean…
A:
Q: A bakery ownertabulated sales to 50 customers and obtained the distribution. Find the mean and…
A: Mean: The mean is the sum of observations divided by number of observations. that is, Mean = x =…
Q: Calculate the weighted mean for sample 1 and sample 2. Sample 1 has 24 scores with a mean of M =…
A:
Q: Suppose a bank branch, located in a commercial district, is concerned with its service during the…
A: We have given that data Observations in the ascending order are…
Q: 6. The following data give the number of new cars sold at a dealership during a 12-day period 13, 5,…
A: see
Q: The mean deviation of the data(1 * :2,9,9,3,6,9,4 from the mean is 2.23 3.23 O 2.57 O 3.57 O
A:
Q: The manager of a local RV sales lot has collected data on the number ofRVs sold per month for the…
A: Weighted mean of sales per month =3.23 Option c is correct
Q: A group of Barangay Health Workers surveyed a sitio of a certain barangay with a population of 30…
A: It is a single value within the range of data which represents a group of individuals values in a…
Q: For this grouped data set: Scores | Frequencies 30-34 | 7 25-29 |…
A: The table shows the calculations required for obtaining the mean: Class(1) Frequency (f)(2) Mid…
Q: Use the following data set to answer the questions. 13 15 20 20 20 20 20 20 20 23 27 31…
A:
Q: The following data set belongs to a population: 5 -7 2 0 -9 16 10 7 Calculate the mean,median and…
A: Data Set - 5, -7, 2, 0, -9, 16, 10, 7 Total number of data values = n = 8
Q: Below we have the mean fitness score and sample size for three samples of participants: Sample…
A:
Q: Approximate the sample mean for the following frequency distribution. Data Frequency 35-38 1 39-42 3…
A: Data Frequency (f) mid-values (x) f.x 35-38 1 36.5 36.5 39-42 3 40.5 121.5 43-46 4 44.5…
Q: For the data below construct the frequency distribution table with 5 classes and after that find: 1)…
A: Given data is appropriate for measures of central tendency to find the central value for the given…
Q: 4. Ms. Risi gives her Data Management class a quiz out of 10. The results are summarized the in the…
A:
Q: 19. The score of students in a Math test is given in the table below. Class Interval 10 - 20 20 -30…
A: It is given that,
Q: The term "snowstorms of note" applies to all snowfalls over 16 6 inches. The snowfall amounts for…
A: Solution: x x^2 7.1 50.41 9.2 84.64 8 64 6.1 37.21 14.4 207.36 8.5 72.25 6.1 37.21…
Q: Find out the mean, median and mode of the following distribution : Marks Frequency Marks Frequency…
A:
Q: a) The following data shows how many employees showed up to work every day for two weeks 12 18 09 16…
A: Data 12,18,9,16,11,10,8,10,13,11,15,17,16,11 (i) IQR=Q3-Q1 (ii) mean (iii) sample standard…
Q: 2. The lengths (in feet) of a random sample of suspension bridges in the United States, Europe, and…
A:
Q: Find the mean for the scores in the following frequency distribution table
A: The frequency table with the corresponding frequencies is, Number Frequency Cumulative frequency…
Q: Use the following frequency distribution table to find the value of the mean score. Scores Frequency…
A: Given frequency distribution table; Scores Frequency(n) mid-point(x) n.x 1-5 3 3 9 6-10 6 8…
Q: Consider the distribution below. Compute for the mean and variance. 10 20 30 40 50 P(x) 5% 5% 25%…
A: Given data is x 0 10 20 30 40 50 P(x) 5% 5% 25% 20% 30% 15%
Q: The frequency table below summarizes a list of the number of laps completed by swimmers during a…
A: Given the data in the above table. To calculate : The mean of the data Formula : Mean =∑xf∑f
Q: a) The following data shows how many employees showed up to work every day for two weeks 12 18 09 16…
A: Given data is 12,18,09,16,11,10,08,10,13,11,15,17,16,11
Q: Suppose a bank branch, located in a commercial district, is concerned with its service during the…
A: The number of observations given is 15. Thus, n = 15.
Q: The table below shows the overtime hours of the employees during a week. Overtime hours 0 1 2 3 4 5…
A:
Q: Compute for the mean and variance of the given frequency distribution below: Score Number of…
A: Frequency (f) f⋅x f⋅x2 5 3 15 75 8 5 40 320 10 4 40 400 12 5 60 720 15 3 45 675 ---…
Q: TT Calculate the median from the following data, if the mean value is 45. Marks No. of Students…
A:
Q: The durations (minutes) of 26 electric power outages in the community of Sonando Heights over the…
A: We have given that data First Arrange data in ascending order. 2, 5, 9, 10, 14, 14, 17, 17, 18,…
Q: a) The following data shows how many employees showed up to work every day for two weeks 12 18 09 16…
A:
Q: Calculate the mean, median mode and standard deviation for the following data: 4600- 4800 75 (b)…
A:
Q: Calculate the mean deviation (from median) from the following data : Class interval Frequency Class…
A:
Q: The following distribution is for the number of children in a family. Find the mean number of…
A: According to the given information, we have The probability distribution table is given by, Y 0 1…
Q: To determine if there is evidence that the mean amount of money spent on food each month differs for…
A: Given that, Mean amount of money spent on food each month differs for students who lived on and off…
Q: The scores that golfers shot on 18 holes at a local course were tabulated. The results are shown in…
A: Given that data Class Frequency 68.5 - 73.5 5 73.5 - 78.5 6 78.5 - 83.5 10 83.5 - 88.5…
answer the following

Step by step
Solved in 2 steps with 2 images
