a) The following data shows how many employees showed up to work every day for two weeks 12 18 09 16 11 10 08 10 13 11 15 17 16 11 Calculate the interquartile range ii. i. Calculate the mean iii. Calculate the sample standard deviation
a) The following data shows how many employees showed up to work every day for two weeks 12 18 09 16 11 10 08 10 13 11 15 17 16 11 Calculate the interquartile range ii. i. Calculate the mean iii. Calculate the sample standard deviation

Glencoe Algebra 1, Student Edition, 9780079039897, 0079039898, 2018
18th Edition
ISBN:9780079039897
Author:Carter
Publisher:Carter
Chapter10: Statistics
Section10.5: Comparing Sets Of Data
Problem 14PPS

Related questions
Question
Practice Pack
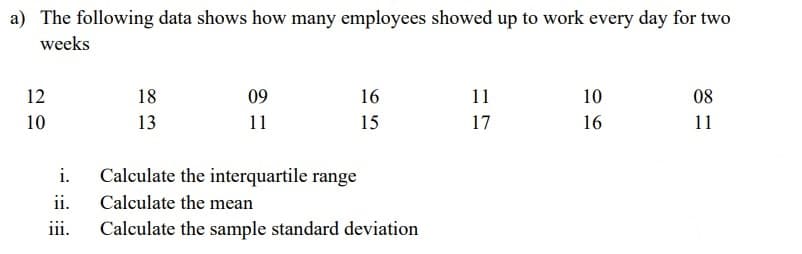
Transcribed Image Text:a) The following data shows how many employees showed up to work every day for two
weeks
12
18
09
16
11
10
08
10
13
11
15
17
16
11
i.
Calculate the interquartile range
ii.
Calculate the mean
iii.
Calculate the sample standard deviation
Expert Solution
This question has been solved!
Explore an expertly crafted, step-by-step solution for a thorough understanding of key concepts.

Includes step-by-step video

Learn your way
Includes step-by-step video

Step by step
Solved in 5 steps with 4 images

Recommended textbooks for you
Glencoe Algebra 1, Student Edition, 9780079039897…
Algebra
ISBN:
9780079039897
Author:
Carter
Publisher:
McGraw Hill
Glencoe Algebra 1, Student Edition, 9780079039897…
Algebra
ISBN:
9780079039897
Author:
Carter
Publisher:
McGraw Hill