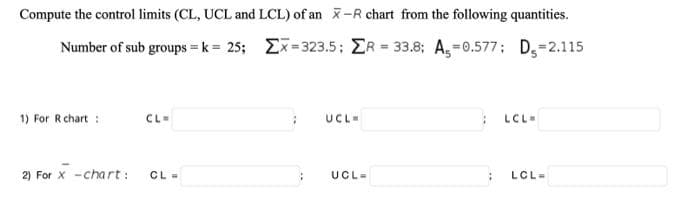
Compute the control limits (CL, UCL and LCL) of an -R chart from the following quantities. Number of sub groups = k = 25; Ex-323.5; ER 33.8; A,=0.577; D,=2.115 1) For R chart: CL- UCL- LCL- 2) For X -chart: CL - UCL- LCL=


Q: Use Simpson's Rule and all the data in the following table to estimate the value of the 10 integral…
A: Simpsons rule
Q: (b) The following data was collected from a person who travelled starting from rest is given in…
A:
Q: Lec 6.1. Defer mine minímun sada number o such that P x) estimates fue)= smx of interpolating points…
A: To find - Determine minimum number of interpolating points (n) such that Pn-1x estimates fx = sinx…
Q: The following table contains data on the temperature and the pressure of a gas in a cylinder. What…
A:
Q: Select the correct answer below: r is significant because it is between the positive and…
A: From the given information, the sample size n = 25.Therefore, the degrees of freedom is n – 2 = 25-2…
Q: is computed as s, = 0.2373361. 11 15 5 17 22 17 11 6 y 18 9 22 12 13 13 12 13 Send data to Excel
A: The data is as follows x y 11 18 15 9 5 22 17 12 22 13 17 13 11 12 6 13…
Q: In a bag of 405 chocolate candies, 43 of them are brown. The candy company claims that 13% of its…
A: Given : probability of success, p=0.13 sample size,n=405
Q: The two data sets are dependent. Find d to the near est tenth. X 6.5 8.9 7.5 8.1 6.8 5.7 7) Y 9.1…
A: Solution: 7. From the given information, the data set is
Q: Through research, a fresh produce packer has determined that out of every n=500 oranges, they should…
A: Solution
Q: Two groups of children, one belonging-to the professional class, 125 in number, and the other…
A:
Q: At 20% set limit, are the collected measurements precise? are the measured data acceptable? Justify…
A: Assume, xi be the random variable representing the measurements. x be the mean of xi. n be the…
Q: 9. The following data represents the temperature T (Fahrenheit) in Kansas City, MO, x hours after…
A: Graph the table and see how it looks like We can see that the points on the table forms an S shaped…
Q: The following data is given: pO = 1500 T0 = 1/3 T 1= 2/3 Σ 1250 u1 = 5200 Using linear…
A:
Q: From the following data compute the quantity index number for 1998 w.r.t. 1993 using (i) general…
A:
Q: FOR DOUBLE COIN TOSS: Combination OV EV D in % Coin 1 Coin 2 HH 27 HT 23 2% ΤΗ 21 25 TT TOTAL 100…
A: Since you have asked multiple questions, we will solve the first question for you. If you want any…
Q: 8. 4. 2. 4. 8. Given the contour graph of f(r, y) shown above estimate ff f (r,y) dA with R = [2, 5]…
A: For given contour graph of fx,y, to estimate ∬Rfx,ydA with R=2,5×3,7 using m=n=2 and midpoints as…
Q: K L used in production does not depend on the input prices (w,r) True False
A: Production function - it is defined to have: Constant returns to scale if (for O < a ) (Function…
Q: Find the Fisher information in this sample of size n about the parameter 8.
A: First we have to calculate the log of f(x,θ) and its second derivative to determine the Fisher…
Q: A sales rep whose territory consists of the six cities in the mileage chart shown to the right.…
A: B) For the path start with A, A→B→D→C→F→E→A You have to take the values with has the minimum cost.
Q: 9. For the following data, test the hypothesis that a relationship exists between X and Y. .30, N =…
A: rxy = 0.30, N =61
Q: With α = .05, the two-tailed critical region for a t test using a sample of n = 20 participants…
A: Here, n = 20
Q: Data was collected for 40 randomly selected honey bee hives on a farm. The number of parasites found…
A: The horizontal axis of the histogram denotes the number of parasites.
Q: Before microwave ovens are sold, the manufacturer must check to ensure that the radiation coming…
A: a) Using the given data take the values of 1 to 25 from x axis , values of 1 to 20 on y-axis and…
Q: Construct index number of price from the following data by applying: 1)Fisher’s Ideal method…
A: Obtain the price index number of price from the following data by applying the Fisher’s Ideal…
Q: An agent for a real estate company in a large city would like to be able to predict the monthly…
A:
Q: A new industrial oven has just been installed at the Piatt Bakery. To develop experience regarding…
A: Given: Data:
Q: BE Drfferentiatethe above relation 20ith respect to p
A: We will apply the concept of differentiation of product of two function
Q: A. Compute the z for each given the following: 1. Claimed proportion = 0.2, Sample proportion =…
A: “Since you have posted a question with multiple sub-parts, we will solve the first three subparts…
Q: The following data refer to visual defects found at inspection of 10 sam ples of size 100. Use tbem…
A:
Q: ch of the fOllowing scales would be best f O black, non-black O white, black, Hispanic, Asian, other…
A: Research as a scientific and systematic approach for pertinent information on a specific domain…
Q: A. Compute the z for each given the following 1. Claimed proportion = 0.2, Sample proportion = 0.18,…
A: Given that Q3) claimed proportion=0.66; p=0.66 sample proportion=0.61;p^=0.61 Sample size =40; n=40…
Q: 2) Are the following variables discrete or continuous? a) Annual rainfall in centimetres: O discrete…
A: Since you have asked multiple question, we will solve the first question for you. If youwant any…
Q: 8, find the X value that corresponds to each of the For a population with uu = 48 and oo = following…
A: Given,mean(μ)=48standard deviation(σ)=8
Q: Calculate each of the following: 1. The Average 2. The Range 3. XGA 4. RA 5. Lower Control Limit…
A: Note: Hi there! Thank you for posting the question. As your question has more than 3 parts, we have…
Q: The graph above shows a line of best fit for data collected on be ant ezedywas and waiteses week in…
A: When x = 0, y = 375 Similarly, if x = 150, y = 625 So, two points are (0,375) and (150,625)
Q: C. If you have only the marginal totals, how can you determine frequencies for each cell that make…
A:
Q: Select the correct answer below: r is significant because it is between the positive and…
A: From the given information, the sample size n = 20.Therefore, the degrees of freedom is n – 2 = 20-2…
Q: Compute both marginals. Are X1 and X2 independent? Justify Compute E(X1) and V(X1).
A: Given that C = 2. For independence we must have f(x1, x2) = f(x1).f(x2)
Q: Step 4 Substitute p = 0.051 and n = 100 into the formula for the lower control limit, rounding the…
A: We have to find given LCL value....
Q: From the following data. Calculate Karl Pearsons co- eficient of Skewness: Class interval Frequency…
A:
Q: 3) Establish the control limits (UCL, CL, and LCL) for X-bar chart. (Assume a = 0.0026) 4) If the…
A:
Q: Mark the critical points on the following graph.
A: Given, To plot the critical points in the graph
Q: 21. Given the following contingency table for Hair colour and Eye colour, find the value of x. Ís…
A:
Q: Calculate Semi-Inter-Quartile Range and its Co-efficient of Q.D. from the following Vata : Marks…
A:
Q: From the following data of the daily wage of 500 workers of a factory find the number of workers :…
A:
Q: Based on Figure 1, (i) Determine the shape of the distribution of monthly gross income for Sarawak…
A: (i) Note that I used R software to construct histograms ⇒income = c3311.5, 4779.17,23634.83,…
Q: The chemist responsible for a ceramics factory evaluated the presence of Cadmium in the vessels…
A: Given Information: Cd (mg/L) 0.4887 0.4758 0.5506 0.4838 0.4901 0.4954 μ=0.5000n=6
Q: The average normal daily temperature ( in degree Celsius) and the corresponding average monthly…
A:
Q: The Sea Wharf Restaurant would le to determine the best way to allocate a monthly advertising budget…
A: The Objective of the LPP is to maximize the value of total Audience exposure by allocating proper…
2

Step by step
Solved in 2 steps with 2 images

- The attached data contains Part Quality data of three suppliers. At = 0.05, does Part Quality depend on Supplier, or should the cheapest Supplier be chosen?The average normal daily temperature ( in degree Celsius) and the corresponding average monthly precipitation( in inches ) for the month of June are shown below for seven randomly selected cities. Compute for the value of r, complete the table with the needed information. Temperature(x) 30 27 28 32 27 23 18 Precipitation(y) 3.4 1.8 3.5 3.6 3.7 1.5 0.2For a population with u=50 and o=10,what is the x value corresponding to z=0.4?
- A study is made for a particular allergy medication in order to determine the length of relief it provides Y (in hours) in relation to the dosage of medication X (in mg). For this reason, ten patients were given different doses of the medication and were asked to report back when the medication seemed to wear off. Patient #1 #2 #3 #4 #5 #6 #7 #8 #9 #10 Dosage (x) Relief Hours (y) 3 3.5 4 5 6 6.5 7 8 8.5 9 9.1 5.5 12.3 9.2 14.2 16.8 22.0 18.3 24.5 22.7 (i) Draw a scatter diagram. (ii) Calculate the product moment correlation coefficient and comment on your answer. (iii) Construct the least squares regression line.A glass manufacturing company wanted to investigate the effect of breakoff pressure and stopper height on the percentage of breaking off chips. The results are in the accompanying table. Complete parts (a) through (e). a. At the 0.01 level of significance is there an interaction between the breakoff pressure and the stopper height? b. is there an effect due to the breakoff pressure? c. is there an effect due to the stopper height? d. Plot the percentage breakoff for each breakoff pressure for each stopper height. e. Discuss the results of (a) through (d).Suppose μ1 and μ2 are true mean stopping distances at 50 mph for cars of a certain type equipped with two different types of braking systems. The data follows: m = 8, x = 114.6, s1 = 5.03, n = 8, y = 129.3, and s2 = 5.38. Calculate a 95% CI for the difference between true average stopping distances for cars equipped with system 1 and cars equipped with system 2. (Round your answers to two decimal places.) ,
- Consider the following data relating hours spent studying (X) and average grade on course quizzes (Y): X Y 5 6 3 8 4 8 7 10 5 7 6 9 Compute SP (equation below) 420 5 6 17A study is made for particular allergy medication in order to determine the length of relief it provides, y (in hours), in relation to the dosage of medication, x (in mg).For this reason, ten patients were given different doses of the medication and wereasked to report back when the medication seemed to wear off.You obtained the following raw data when setting up a Biuret standard curve: BSA (mg/ml) Absorbancy 540nm 0 0.158 1 0.210 2 0.260 3 0.305 4 0.360 5 0.410 6 0.455 7 0.510 8 0.530 9 0.550 10 0.554 What would the quality of the line-fit (R2 value) be if you do not exclude experimental outliers? (Give you answer to 4 decimal places)
- Q1 A) List down the measures of central tendency and measures of dispersion 2) The operations manager of a plant that manufactures tires wants to compare the actual inner diameters of two grades of tires, each of B) which is expected to be 575 millimeters. A sample of five tires of each grade was selected, and the results representing the inner diameters of the tires, ranked from smallest to largest, are as follows. Grade X grade Y 568 570 575 578 584 573 574 575 577 578 requirement. a) for each of the tow grades of tries, compute the mwan, median, and standred deviation. b) which grade of tire providing better quality? explain. c) what would be the effect on your answer in (a) and (b) if the last value for grade Y were 588 insert 578 explain. C) The file contins the overall miles per gallon (MPG) OF 2010 family sedan: 24 21 22 23 24 34 34 34 20 20 22 22 44 32 20 20 22 20 39 20 Source:…Determine the best (according to sum-of-squares-measure) curve y = Axb, through the dataabove.Transformed equation ln(y) = ln(A) + b ln(x)orY = a + bX.A survey among the workers in a large manufacturing company was taken, in order to findout from which company the workers had purchased their mobile phones, and to find outwhether the choice of mobile phone company was related to the type of worker. The resultsare shown in the table below. ls there evidence, at 5% level, that the choice of Phone Company is independent of the type ofworker?