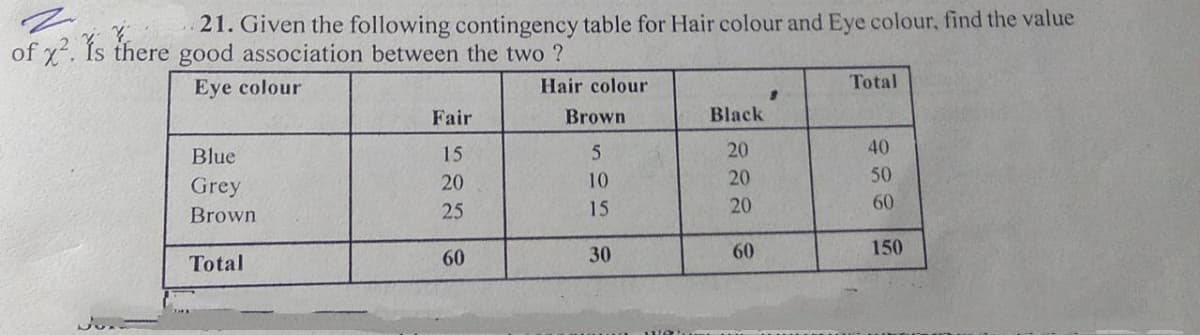
21. Given the following contingency table for Hair colour and Eye colour, find the value of x. Ís there good association between the two ? Eye colour Hair colour Total Fair Brown Black Blue 15 20 40 Grey 20 10 20 50 Brown 25 15 20 60 60 30 60 150 Total


Q: Question 1c
A: Given following table a)The total number of respondents = 300The total number of respondents below…
Q: 3. A survey of households connected to North Park Secondary Night School found that 96% had Netflix…
A:
Q: 11.12 A drug company is interested in investigating whether the color of their packaging has any…
A: 11.12 From the given information, the null hypothesis states that the number of packages sold of…
Q: The population size of Batangas in 2015 is 2,600,000. This increased to 2,908,494 based on the last…
A:
Q: 8 The following are the number of minutes it takes 10 typists to finish a piece of secretarial work…
A: Scatter plot: A Scatter plot is a non-mathematical representation of data, that shows the degree of…
Q: The table below shows the number of state-registered automatic weapons and the murdéř rátě for…
A: Excel Procedure: Enter x and y in Excel>Data>Data Analysis> ‘Regression’>Select y under…
Q: Given the following information: Class Interval 10-20 20-30 30-40 Frequency 8 12 Calculate Less than…
A:
Q: Table 1: Significant difference in the Management Capability of Administrators When Grouped Gender…
A: From the given information, Null Hypothesis: H0: There is no significance difference in the…
Q: For a population with u = 100 and o = 20, what is the X value corresponding to z = 1.50? O 130 O 30…
A:
Q: Given are the scores of 10 employees from their 20-point assessment 16 18 10 8 12 15 19 17 16 7…
A:
Q: At how many pitchers of excessive beer consumption would a spring breaker be considered an outlier?…
A:
Q: Given the following contingency table for Hair colour and Eye colour, find the value of x?. Is there…
A:
Q: Given are the scores of 10 employees from their 20-point assessment 16 18 10 8 12 15 19 17 16 7…
A: Given are the scores of 10 employees from their 20-point assessment Scores are :…
Q: 49. FILE The National Highway Association is studying the relationship between the number of bidders…
A: Hi! Thank you for the question, As per the honour code, we are allowed to answer three sub-parts at…
Q: 1. Following tablegives the birth rates and death rates per thousand of a few courtries. What…
A: GivenBirth rates and death rates per thousand of few countriesCountryBirth rateDeath…
Q: The number of sick days taken (per month) by 200 factory workers is summarized below. Number of…
A: We have to find :-The number of workers who took more than 10 sick days per month is _____.
Q: Each respondent was given a score, from 1 to 15, on his or her knowledge of the COFLU-20. A score…
A: Consider the following events, A=respondent is below 35 years of ageB=respondent has a good…
Q: i. Find the followlng probablities. Polnts per game frequency 0. 10 4 15 12 TOTAL:47 11. P(x>1) =…
A: Given that Frequency distribution table Point per game Frequency 0 2 1 3 2 5 3 10 4…
Q: The distribution of number of stores according to size in 3 areas is given in the following table:…
A: No. of L stores = 50+150+20=220 No. of M stores =50+105+130=285 No. of S stores =75+260+150=485…
Q: Given the following contingency table comparing class and grades answer the following questions. A B…
A: percent of student with grade C and sophomore=8% percent of student with grade C and junior =6%…
Q: If mu and sigma are the process mean and sd then the control limits mu+or- 3sigma are know as
A:
Q: A survey at a ballpark shows this selection of snacks purchased. At a = 0.10, is the snack chosen…
A: There are two cases which are Gender and Snack. Gender has two types that are male and female. Snack…
Q: b) Given the following category table for hair colour and eye colour. Find the value of . Is there…
A: Hi! Thank you for the question, As per the honor code, we are allowed to answer one question at a…
Q: (i) is below 35 years of age and has good knowledge of the COFLU-20 (ii) is below 35 years of age…
A: Solution: c. i. Let A be the event that respondent is below 35 years of age and B be the event that…
Q: If frequency of an item z is given as 9, and total number of items in the collected data is 43; then…
A: The relative frequency is given by, Relative Frequency=fn Where, f is the frequency the data…
Q: A new RX is designed to reduce blood pressure, and is being tested in two doses (100 mg and 50 mg).…
A: In the given case we want to test if there is any significant effect of the doses of the new RX in…
Q: 2. What is the size of the observed difference between the means for Groups A and C? (Subtract the…
A: It is given that Mean for group A = 2.000 Mean for group B = 2.250 Mean for group C = 6.500
Q: 6. Given the following pairs of corresponding values of X and Y: X: 20 25 30 35 40 Y: 73 198 573…
A: We have given that, The pairs of corresponding values of X and Y are :- X :- 20, 25, 30,…
Q: If frequency of an item z is given as 2, and total number of items in the collected data is 40; then…
A: Given the frequency of an item x is 2 and total number of items in the collected data is 40. We have…
Q: 11. From the following data estimate the number of students getting marks etween 20 and 25. Marks…
A: Given : Marks below 10 below 20 below 30 below 40 below 50 Number of student 20 45 115 210 325
Q: Given are the scores of 10 employees from their 20-point assessment 16 18 10 8 12 15 19 17 16 7 D3 =…
A:
Q: i. Find the following probablities. Points per game frequency 10 15 12 TOTAL:47 11. P(x>1) = 12.…
A:
Q: The following are four consecutive weeks earnings of five salesman employed by a given firm Test at…
A: Software procedure: Step-by-step procedure to obtain the one-way ANOVA table by using MINITAB…
Q: If frequency of an item is given as 6, and total number of items in the collected data is 39; then…
A: We know that the, If f1, f2,..., fn are the frequencies of a dataset, and total frequency is N= Σfi…
Q: Each respondent was given a score, from 1 to 15, on his or her knowledge of the COFLU-20. A score…
A:
Q: 4. Review the table and consider questions such as the following. Needs | Origin / Rating…
A: Since you have posted a question with multiple subparts, we will solve first three subparts for you.…
Q: Each respondent was given a score, from 1 to 15, on his or her knowledge of the COFLU-20. A score…
A: Let A be the event that respondent is below 35 years of age and B be the event that a respondent has…
Q: The following contingency table is on Autism and Breastfeeding: Autism None Less than 2 months 2 to…
A: Given data: Autism None Less than 2 months 2 to 6 months More than 6 months Total Yes 241 198…
Q: 7. If the minimum value of data equal 10 and maximum value of data equal 50 and the number of class…
A:
Q: the following data represent the operating time in hours fro 4 types of pocket calculators before a…
A: In order to determine whether the mean operating time of 4 types of calculators Fx101, Fx202, Fx303,…
Q: Use the contingency table to solve the problem. Blood Type A B АВ Total Female 48 44 15 Sex Male 43…
A:
Q: Each respondent was given a score, from 1 to 15, on his or her knowledge of the COFLU-20. A score…
A: According to given data table: Total number of respondent: i). Number of respondent who are below 35…
Q: Are there differences in airfare depending on which travel agency website you utilize? Suppose the…
A: From the given information, Null Hypothesis: H0: There is no significant differences in the mean…
Q: Below is a bar graph of the 138 surveyed riders' satisfaction response. 40 30 10 very unsatisfied…
A: We have to find no.of riders are satisfied or very satisfied.
Q: In 2007, the percentage of children under 18 years of age who lived with both parents was 71.1, the…
A:
Q: Explain whether each of the following represents a population or a sample. d. Yield of tomatoes per…
A: A population represents the entire group that you want to draw conclusions about. A sample is a…
Q: The table below shows automatic weapons and Northwestern states. X Y 11.8 8.6 14.1 11.5 thousands of…
A: The given data is x y 11.8 14.1 8.6 11.5 7 9.8 3.3 7.1 2.5 6.2 2.5 6.5 2.6 6 0.9…
Q: Given the following contingency table for Hair colour and Eye colour, find the value of x. Is there…
A: Given that: A contingency table is given Firstly we calculate expected frequency (E) E = (R × C )…
Q: Following table is generated by using cross tabulation method. Interpret the results. Gender…
A: Given Information: Consider the given table: Gender Employment Employed Unemployed Total…

Step by step
Solved in 2 steps with 2 images

- Answer this question using the contingency Table and probailities. Varaible 1 is Death trend Vraiable 2 is AdultVacTrendConsider that Roane county, which calculated that the average firm size (in terms of number of employees) is 150 with a median size of 50, while Anderson county calculated an average and median size of 230 and 255 respectively. Officials from both counties are asking their state legislatures for additional funds to accommodate their growing business size. Do you support their requests, why or why not? Also, are there any additional statistics you might ask for and why?Develop two research hypotheses: (a) one that would be used to examine differences between two unrelated groups and (b) one that would examine differences between two dependent groups.
- Consider the corresponding contingency table in a sample of patients from a hospital. There is the following table where the risk of heart attack is considered with respect to taking aspirin: What percentage of patients are at risk for a heart attack and take aspirin?The Bureau of Transportation reports on-time performance for airlines at major airports. JetBlue, United, and US Airways share Terminal C and Boston's Logan Airport. The percentage of on-time flights reported for a sample month were 76.8% for JetBlue, 71.5% for United, and 82.2% for US Airways. Assume that 30% of the arriving flights at this terminal are JetBlue flights, 32% are United flights, and 38% are US Airways flights. a. Develop a contingency table (table of joint probabilities and marginal probabilities). b. An announcement is made that Flight 1382 will arrive at Terminal C. What is the probability that the flight will arrive on time? c. Flight 1382 arrives on time. What is the probability that Flight 1382 is operated by US Airways? d. Flight 1382 will not arrive on time. What is the probability that Flight 1382 is operated by United?The human papillomavirus associated with the development of cervical cancer, genital warts, and some less common cancers. John Hopkins conducted a study to investigate the characteristics of female patients who came to their clinics between 2006 and 2008 to begin the three-shot regimen of vaccinations with the anti-human papillomavirus (HPV) medication Gardasil. A contingency table summarizing the vaccine completions by race for 1222 patients is provided below. 1.State the null and alternative hypotheses. 2.Compute the test statistic. Compute the test statistic. Document how the expected counts and the value of the test statistic are computed and enter them into the table and input box provided. Round the expected counts to 3 decimal places and the test statistic to 2 decimal places. 3.Compute the p-value. Provide the name of the distribution and the parameters used to compute the p-value. Then enter your anwer rounded to 4 decimal places. 4.Interpret the results of the significance…
- ______ are defined as the means in a table that represent a main effect. Group of answer choices Main means Marginal means Cell means Interaction meansBased on the Tukey Post-Hoc table (above), is there a significant difference between the text and video groups?Based on the Tukey Post-Hoc table (above), is there a significant difference between the text and phone groups? Based on the Tukey Post-Hoc table (above), is there a significant difference between the video and phone groups?Consider the corresponding contingency table in a sample of patients from a hospital. There is the following table where the risk of heart attack is considered with respect to taking aspirin: What percentage of patients who have suffered a fatal heart attack have taken aspirin?
- 7. The city council of Pine Bluffs is considering increasing the number of police in an effort to reduce crime. Before making a final decision, the council asked the chief of police to survey other cities of similar size to determine the relationship between the number of police and the number of crimes reported. The chief gathered the following sample information. City Police Number of Crimes City Police Number of Crimes Oxford 23 18 Holgate 24 9 Starksville 24 15 Carey 20 22 Danville 30 9 Whistler 19 24 Athens 33 11 Woodville 27 10 Click here for the Excel Data Filea. Determine the regression equation. (Negative amounts should be indicated by a minus sign. Round your answers to 4 decimal places.) b. Estimate the number of crimes for a city with 21 police officers. (Round your answer to the nearest whole number.) c. Interpret the…According to the Pew Research Center,on the propotion of the American population who use only a cellular telephone (landline) is 0.37. Jason conducts a survey of one hundred fifty 20 to 24 year olds who live on their own and finds that 73 do not have a landline to their home. Does this provide sufficient evidence to conclude that the proportion of 20 to 24 year olds who live on their own and don't have a landline is greater than 0.37? Use a=0.10 level of significance. A) Verify that nP0(1-P0)>10 and n< 0.05N (Assume the population sizes is N=40 million) B) State the appropiate null and alternative hypotheses. C) Indicate whether the hypothesis is left, right, or two- tailed.According to the Pew Research Center,on the propotion of the American population who use only a cellular telephone (landline) is 0.37. Jason conducts a survey of one hundred fifty 20 to 24 year olds who live on their own and finds that 73 do not have a landline to their home. Does this provide sufficient evidence to conclude that the proportion of 20 to 24 year olds who live on their own and don't have a landline is greater than 0.37? Use a=0.10 level of significance. D) Compute the test statistic z0. Round to the nearest hundredth. E) Draw a normal model with the area that represents the P-value shaded. F) Determine and interpret the P-value. What is the conclusion of the hypothesis test?
