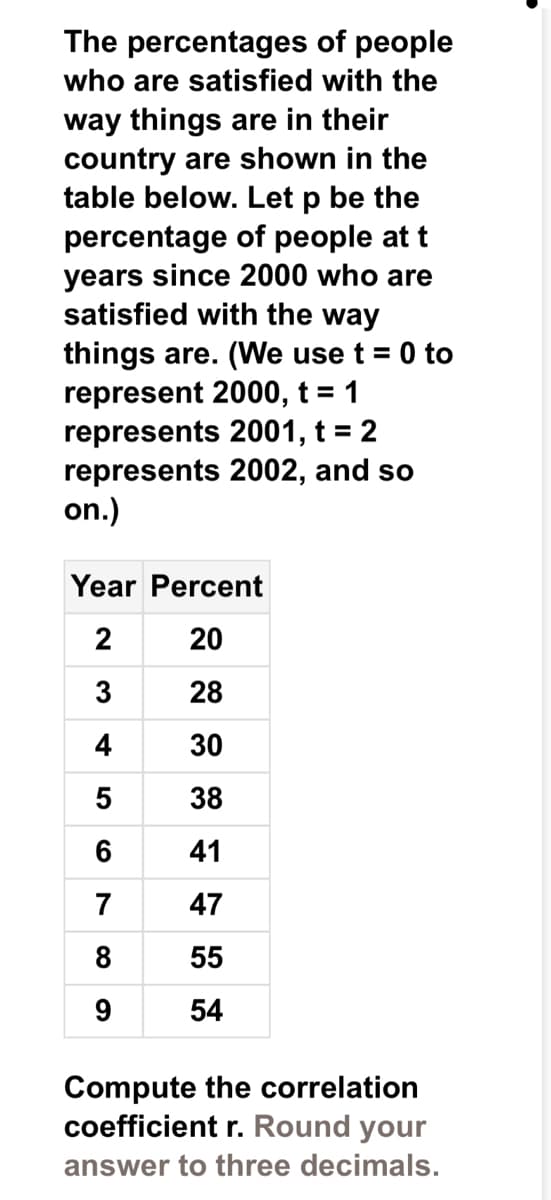
Compute the correlation coefficient r. Round your answer to three decimals.


Q: Suppose you are testing a 2-tailed hypothesis concerning the population mean using the Student's…
A: Answer:- Given, Sample size, n = 11 Test statistic is, t = -1.796 Two-tailed hypothesis test.…
Q: 7. A multiple regression analysis with annual profits of a pharmaceutical product as the dependent…
A: From the given information , The number of Parameters estimated is:- K = 3 ( One…
Q: 10 297002 s sall.m 3. Find the mean, variance and standard variation (Do not use calculator 1, 2, 3,…
A: 1, 2, 3, 4, 6, 8, 12 Sample size n =7
Q: Figure 6(a) shows the time series of the annual suicide rate (per 100,000 inhabitants) in Australia,…
A: Given the graphs showing the time series of the annual suicide rate (per 100,000 inhabitants) in…
Q: 6). If X is a binomial random variable with n=6 and p=0.4, the probability P(X21) is A) 0.2333 B)…
A: Q-6)binomial distributionn = 6p = 0.4P(x≥1) = ? Q-7)binomial distributionn = 9p = 0.4standard…
Q: Country A Country B Country C Country D Country E Trade Deficits (in billions of dollars) Country L…
A: Values in ascending order: 11.1, 13.2, 15.7, 16.2, 26.5, 26.7, 27.1, 29.1, 33.0, 33.0, 40.7, 43.7,…
Q: The t-value of t = fall between -to.95 and to.95 because to.95
A: given that n = 13 sample mean = 1195 sample standard deviation = 169.3 population mean = 1016
Q: Sue and Javier are working on a statistics project to estimate the proportion of students at their…
A: Sample size (n)=2400 Sue select 81 sample and Javier select 64 The formula for 100(1-α)%…
Q: Consider two completely different data sets: price per gallon of gas in Fort Pierce and SAT scores…
A: The formula to obtain the Coefficient of variation is,
Q: You are given the sample mean and the population standard deviation. Use this information to…
A: Given that: n=66 Sample size x=85.44 Sample mean σ=13.81 Population standard deviation
Q: On the two SPSS outputs shown below, with a = .05, you should conclude... One-Sample T-Test…
A: One sample T-test is used to test whether the population mean differs from the hypothesized value or…
Q: 2). If a random variable X has a normal distribution with mean u = 60 and standa P(55 < X < 66) - A)…
A: Q-2)normal distributionμ = 60σ = 6P(55<x<66) = ?Q-3)μ = 69σ = 12n = 36μx¯ ?σx¯ = ?
Q: A moving average of order 11 has been applied to a time series. The resulting time series appears…
A: The first 7 values of the times are, t 1 2 3 4 5 6 7 xt 1.2 3.2 2 0.8 0.5 2.6 1.3
Q: The data given below show the number of overtime hours worked in one week per employee. Use the data…
A: The question is about discrete prob. distribution Given : To find : a ) Construct prob. dist. b )…
Q: The histograms each represent part of a binomial distribution. Each distribution has the same…
A: The three histograms of Binomial distribution are given. Each dist. has the same prob. of success…
Q: determined there was a positive correlation between the number of study hours a week a udent spends…
A: Regression equation y^=2.663x+41
Q: Use the frequency distribution shown below to construct an expanded frequency distribution.
A: Here given frequency distribution of grouped data.
Q: Menstrual cycle length. Menstrual cycle lengths (days) in an SRS of nine women are as follows: {31,…
A: From the provided information, Sample size (n) = 9 The data values are as follow: {31, 28, 26, 24,…
Q: Identify the rejection region(s). Choose the correct answer below. O A. OB. O C.
A: Let μ be the population mean the life of a light bulb. Given that, Population mean (μ)=754 hoursNo.…
Q: The following table shows the systolic blood pressure of 5 women and 5 men. Women Men 110 114 120…
A: Let, x denotes the B.P. of women and y denotes the B.P. of men. The data is given as- x: Women…
Q: Select all of the characteristics of a standard Normal distribution. Group of answer choices…
A: Standard normal distribution: It is a type of probability distribution. It is also known as a…
Q: A sample of 150 married women determined that 127 are happy in their marriage. A sample of 150…
A: The data is given as- for women, n1=150x1=127 For men, n2=150p2^=x2n2=0.76
Q: An analysis of variance produces SSbetween = 40, SSwithin = 60, and an F-ratio with df = 2, 15. For…
A: It is given that: SSBetween=40SSWithin=60df1=dfBetween=2df2=dfWithin=15
Q: Test the independence of the two variables in the table below: Enter the p-value (to 4 decimal…
A: Y
Q: If the probability that your DVD player breaks down before the extended warranty expires is 0.021,…
A: P(DVD player break down before extended warranty expires) = p = 0.021 P(DVD player will not break…
Q: Figure 7(a) shows the correlogram of a stationary time series; Figure 7(b) shows the partial…
A: Given the correlogram and the partial correlogram of a stationary time series as
Q: Why is it necessary to check that np ≥ 5 and nq ≥ 5? A. It is necessary to check that np≥5 and nq ≥5…
A:
Q: A psychologist would like to examine the effects of different testing methods on the final…
A: Anova is the measure of mean significance between three or more groups. If there exists a…
Q: D D Question 1 Write the answer as a decimal, accurate to 4 decimal places. If a bag contains 8…
A: The bag contains 8 green balls, 7 blue balls and 9 red balls.
Q: A sample of 150 married women determined that 127 are happy in their marriage. A sample of 150…
A: That is, there is no evidence to conclude that the percent of women married who are happy in their…
Q: For the standard normal curve, find the z-score that corresponds to the 7th decile
A: standard normal distribution Z~N(0,1) find z score correspond to 7th decile
Q: The weight of oranges growing in an orchard is normally distributed with a mean weight of 8 oz. and…
A: From the given information Mean , μ=8 Standar deviation σ=1.5 We have to find how many orange…
Q: 2) Sample mean can be used to make estimations of population mean. Considering the following…
A: The population standard deviation is σ=11. The sample size is n=100. The sample mean is x¯=8. The…
Q: 5. Find the followings: mean, mode, median and midrange. 53, 52, 75, 62, 68, 58, 51, 51
A: 53, 52, 75, 62, 68, 58, 51, 51 Sample size n =8 Arrange the data set in ascending order are.…
Q: Subgroups of power supply units are selected once each hour from an assembly line, and the…
A: The data relates to 25 subgroups of power supply units. The sum of the resulting ranges for 25…
Q: A flood insurance policy has the following distribution this year: 1. The frequency of claims has a…
A: The frequency of claims has a Poisson dist. with λ=4 The severity of claims has a Pareto dist. with…
Q: Newborn weight. A study takes a SRS from a population of full-term infants. The standard deviation…
A: σ = 2n = 9x¯ = 7construct 95% ci for μ.
Q: The Stanford University Heart Transplant Study was conducted to determine whether an experimental…
A: The data for the patients who survived and died in treatment and control groups are given.
Q: In a sample of 1200 U.S. adults, 204 think that most celebrities are good role models. Two U.S.…
A: From the provided information, In a sample of 1200 US adults, 204 think that most celebrities are…
Q: 2. Below is data on the number of vehicles involved in a fatal crash and city in California during…
A: Single-vehicle crash fatalities Two-vehicle crash fatalities LA 175 69 SD 61 19 SJ 49 19…
Q: Evaluate the given expression and express the result using the usual format for writing numbers…
A: To find the value of the combination.
Q: An experiment is run. The mass of an object is recorded over time. Time (min) Mass (g) 12 39 18 37…
A: An experiment is run. The mass of an object is recorded over time. Time (min) Mass(g) 12 39…
Q: Let x be a random variable representing dividend yield of bank stocks. We may assume that x has a…
A: Data X: 5.7 4.8 6.0 4.9 4.0 3.4 6.5 7.1 5.3 6.1 Sample size (n)=10 Sample mean x-=5.38 Population…
Q: A study seeks to estimate the difference in the mean fuel economy (measured in miles per gallon) for…
A: The 90% confidence interval for the true difference in the mean fuel economy for cars is -3.339 mpg…
Q: Find the Conversion Factors for the following recipes: Start by finding number of ounces in Original…
A: The recipe can be adjusted using the recipe conversion factors. The recipe conversion factor is…
Q: 26. Consider a discrete-time surplus process and assume that the frequency of the claims in each…
A: Given that the frequency of claims in each period is Negative Binomial with mean 1 and variance 16,…
Q: A therapist is interested on investigating whether there are any significant mean differences in the…
A: 1. The groups being compared are the different treatment methods for stress among students with…
Q: (a) No preliminary estimate is available. Find the minimum sample size needed. (b) Find the minimum…
A: A researcher wishes to estimate, with 95% confidence, the population proportion of adults who think…
Q: In a random sample of four mobile devices, the mean repair cost was $85.00 and the standard…
A: From the provided information, Sample size (n) = 4 Sample mean (x̄) = 85.00 Sample standard…
Q: Suppose 82% of all students at a large university own a computer. If 6 students are selected…
A: In this case, each student has the only options of "owning a computer" (defined as success) or "not…

Step by step
Solved in 3 steps with 1 images
