Compute the heights of the histogram for the intervals 20 to < 24 and 24 to < 59.

Glencoe Algebra 1, Student Edition, 9780079039897, 0079039898, 2018
18th Edition
ISBN:9780079039897
Author:Carter
Publisher:Carter
Chapter10: Statistics
Section10.6: Summarizing Categorical Data
Problem 4DGP

Related questions
Question
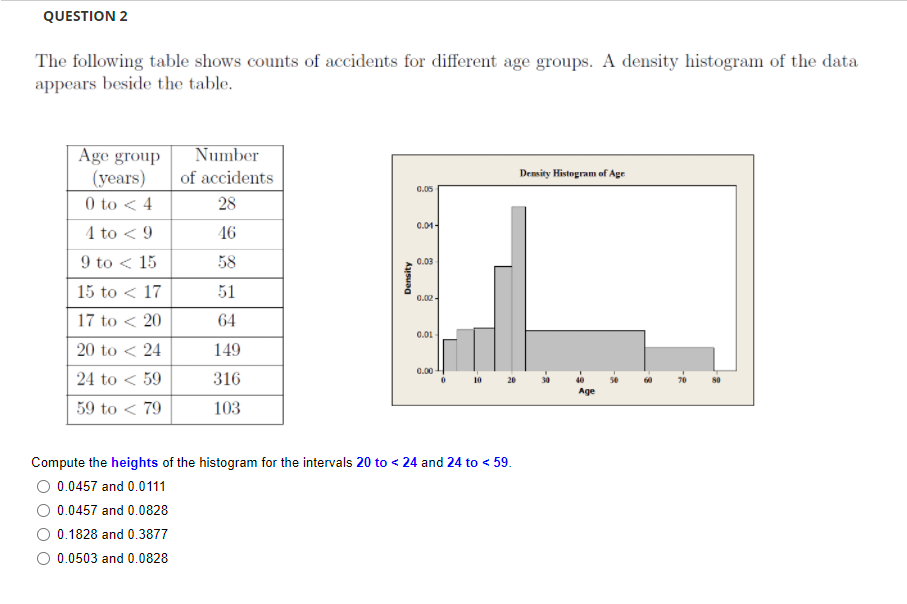
Transcribed Image Text:QUESTION 2
The following table shows counts of accidents for different age groups. A density histogram of the data
appears beside the table.
Number
Age group
(years)
of accidents
Density Histogram of Age
0.05
0 to < 4
28
0.01
4 to < 9
46
9 to < 15
58
0.03
15 to < 17
51
0.02
17 to < 20
64
0.01
20 to < 24
149
0.00
24 to < 59
316
10
40
Age
59 to < 79
103
Compute the heights of the histogram for the intervals 20 to < 24 and 24 to < 59.
0.0457 and 0.0111
0.0457 and 0.0828
0.1828 and 0.3877
0.0503 and 0.0828
Density
Expert Solution
This question has been solved!
Explore an expertly crafted, step-by-step solution for a thorough understanding of key concepts.

This is a popular solution!

Trending now
This is a popular solution!

Step by step
Solved in 2 steps

Recommended textbooks for you
Glencoe Algebra 1, Student Edition, 9780079039897…
Algebra
ISBN:
9780079039897
Author:
Carter
Publisher:
McGraw Hill
Glencoe Algebra 1, Student Edition, 9780079039897…
Algebra
ISBN:
9780079039897
Author:
Carter
Publisher:
McGraw Hill