Compute the sample mean and the sample standard deviation.

Algebra & Trigonometry with Analytic Geometry
13th Edition
ISBN:9781133382119
Author:Swokowski
Publisher:Swokowski
Chapter5: Inverse, Exponential, And Logarithmic Functions
Section5.6: Exponential And Logarithmic Equations
Problem 67E

Related questions

Question
Compute the sample
Transcribed Image Text:b/ui/evo/index.html?elSBN=9780357131596&id%3D9974259648snapshotld%3D18993728
GAGE MINDTAP
Q Search this cou
ent 7 Chapter 9
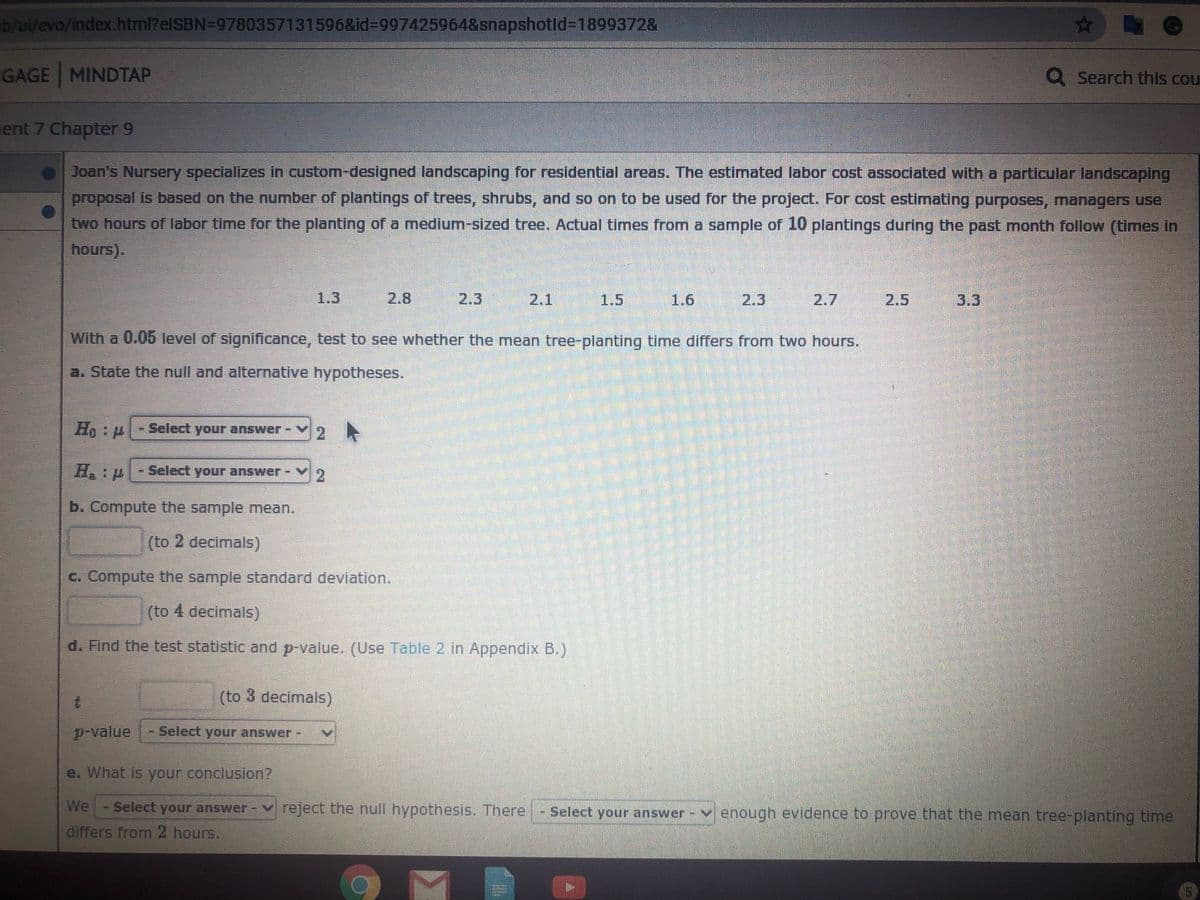
Joan's Nursery specializes in custom-designed landscaping for residential areas. The estimated labor cost associated with a particular landscaping
proposal is based on the number of plantings of trees, shrubs, and so on to be used for the project. For cost estimating purposes, managers use
two hours of labor time for the planting of a medium-sized tree. Actual times from a sample of 10 plantings during the past month follow (times in
hours).
1.3
2.8
2.3
2.1
1.5
1.6
2.3
2.7
2.5
3.3
With a 0.05 level of significance, test to see whether the mean tree-planting time differs from two hours.
a. State the null and alternative hypotheses.
Ho : H
- Select your answer-V
2.
Ha: P
Select your answer-V
2.
b. Compute the sample mean.
(to 2 decimals)
C. Compute the sample standard deviation.
(to 4 decimals)
d. Find the test statistic and p-value. (Use Table 2 in Appendix B.)
(to 3 decimals)
p-value
- Select your answer-
e. What is your conclusion?
We-Select your answer
- v
reject the null hypothesis. There - Select your answer - v enough evidence to prove that the mean tree-planting time
differs from 2 hours.
Expert Solution
This question has been solved!
Explore an expertly crafted, step-by-step solution for a thorough understanding of key concepts.

This is a popular solution!

Trending now
This is a popular solution!

Step by step
Solved in 3 steps

Knowledge Booster


Learn more about
Need a deep-dive on the concept behind this application? Look no further. Learn more about this topic, statistics and related others by exploring similar questions and additional content below.Recommended textbooks for you
Algebra & Trigonometry with Analytic Geometry
Algebra
ISBN:
9781133382119
Author:
Swokowski
Publisher:
Cengage
Algebra & Trigonometry with Analytic Geometry
Algebra
ISBN:
9781133382119
Author:
Swokowski
Publisher:
Cengage