Compute the value of X in Table 2. ii) Estimate mass that dissolved in the water if the temperature is set at 100 Celcius.
Compute the value of X in Table 2. ii) Estimate mass that dissolved in the water if the temperature is set at 100 Celcius.

Glencoe Algebra 1, Student Edition, 9780079039897, 0079039898, 2018
18th Edition
ISBN:9780079039897
Author:Carter
Publisher:Carter
Chapter4: Equations Of Linear Functions
Section4.5: Correlation And Causation
Problem 2AGP

Related questions
Question
i) Compute the value of X in Table 2.
ii) Estimate mass that dissolved in the water if the temperature is set at 100 Celcius.
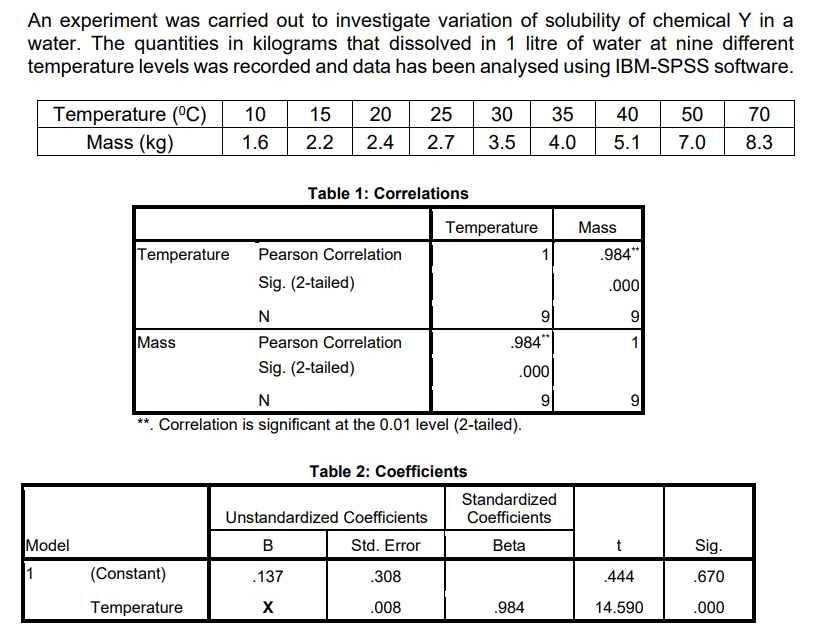
Transcribed Image Text:An experiment was carried out to investigate variation of solubility of chemical Y in a
water. The quantities in kilograms that dissolved in 1 litre of water at nine different
temperature levels was recorded and data has been analysed using IBM-SPSS software.
Temperature (°C)
Mass (kg)
Model
Temperature
Mass
10 15 20 25
1.6 2.2 2.4 2.7
(Constant)
Temperature
Table 1: Correlations
Pearson Correlation
Sig. (2-tailed)
N
Pearson Correlation
Sig. (2-tailed)
Unstandardized Coefficients
B
Std. Error
.137
X
30 35 40
3.5
4.0 5.1
N
**. Correlation is significant at the 0.01 level (2-tailed).
Table 2: Coefficients
.308
.008
Temperature
9
.984**
.000
9
1
Standardized
Coefficients
Beta
.984
Mass
.984**
.000
9
1
t
.444
14.590
50
7.0
Sig.
.670
.000
70
8.3
Expert Solution
This question has been solved!
Explore an expertly crafted, step-by-step solution for a thorough understanding of key concepts.

Step by step
Solved in 2 steps with 1 images

Recommended textbooks for you
Glencoe Algebra 1, Student Edition, 9780079039897…
Algebra
ISBN:
9780079039897
Author:
Carter
Publisher:
McGraw Hill

Algebra & Trigonometry with Analytic Geometry
Algebra
ISBN:
9781133382119
Author:
Swokowski
Publisher:
Cengage

College Algebra
Algebra
ISBN:
9781305115545
Author:
James Stewart, Lothar Redlin, Saleem Watson
Publisher:
Cengage Learning
Glencoe Algebra 1, Student Edition, 9780079039897…
Algebra
ISBN:
9780079039897
Author:
Carter
Publisher:
McGraw Hill
Algebra & Trigonometry with Analytic Geometry
Algebra
ISBN:
9781133382119
Author:
Swokowski
Publisher:
Cengage
College Algebra
Algebra
ISBN:
9781305115545
Author:
James Stewart, Lothar Redlin, Saleem Watson
Publisher:
Cengage Learning

Linear Algebra: A Modern Introduction
Algebra
ISBN:
9781285463247
Author:
David Poole
Publisher:
Cengage Learning