Confidence Interval Hypothesis Test


A fair die, with its faces numbered from 1 to 6, is one in which each number is equally likely to land face up when the die is rolled. On a fair die, the probability that the number 6 will land face up is 1/6. A group of students wanted to investigate a claim about manipulating a fair die so that it favors one outcome. The claim states that if a fair die is put into an oven and baked at 200°F for 10 minutes, the inside of the die will begin to melt. When the die cools, the inside will be solid again, but with more weight toward the bottom. This shift in weight will cause the face that was up when the die cooled to land up more often that the other faces.
The students obtained a fair die and baked it according to the preceding directions. The die cooled with the number 6 face up. After the die cooled, they rolled the die 200 times, and the number 6 landed face up 43times. Let p represent the population proportion of times the number 6 will land face up on the baked die if the die could be rolled an infinite number of times.
(a) Clarke, one of the students, constructed a 95 percent confidence interval for p as 0.215±0.057. Does the interval provide convincing statistical evidence that the number 6 will land face up more often on the baked die than on a fair die? Explain your reasoning.
(b) Aurelia, another student, suggested they conduct a significance test to investigate the claim. She tested the hypotheses H0:p=1/6 versus Ha:p>1/6 at the significance level of α=0.05. She obtained a test statistic of 1.83 with a p-value of 0.033. Do the results of the significance test agree with the results of Clarke’s confidence interval in part (a)? Explain your reasoning.
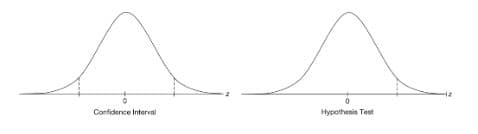
(c) Two standard normal curves are shown below, one for the confidence interval calculated in part (a) and one for the significance test conducted in part (b).
(i) For the confidence interval curve, label the critical values for the 95% confidence level and shade the area that represents values in the outer 5%.
(ii) For the significance test curve, label the critical value for the 5% significance level and shade the area representing the values of z that would lead to a rejection of the null hypothesis in part (b).
(d) Joachim, a third student, noted that the confidence interval in part (a) gives plausible values of the parameter as an interval between two values. He suggested that they develop a one-sided confidence interval because they were only concerned with whether the number 6 was landing face up more often than expected, not less often. The one sided-interval will determine a value L such that all plausible values of pare greater than L. The formula for L is L=pˆ+z∗pˆ(1−pˆ)n−−−−−√.
(i) Determine the values of z∗ needed to create the one-sided 95 percent confidence interval. Then calculate the value of L.
(ii) Do the results of Joachim’s one-sided confidence interval agree with results of Aurelia’s significance test in part (b)? Explain your reasoning.


Trending now
This is a popular solution!

Step by step
Solved in 2 steps with 2 images


