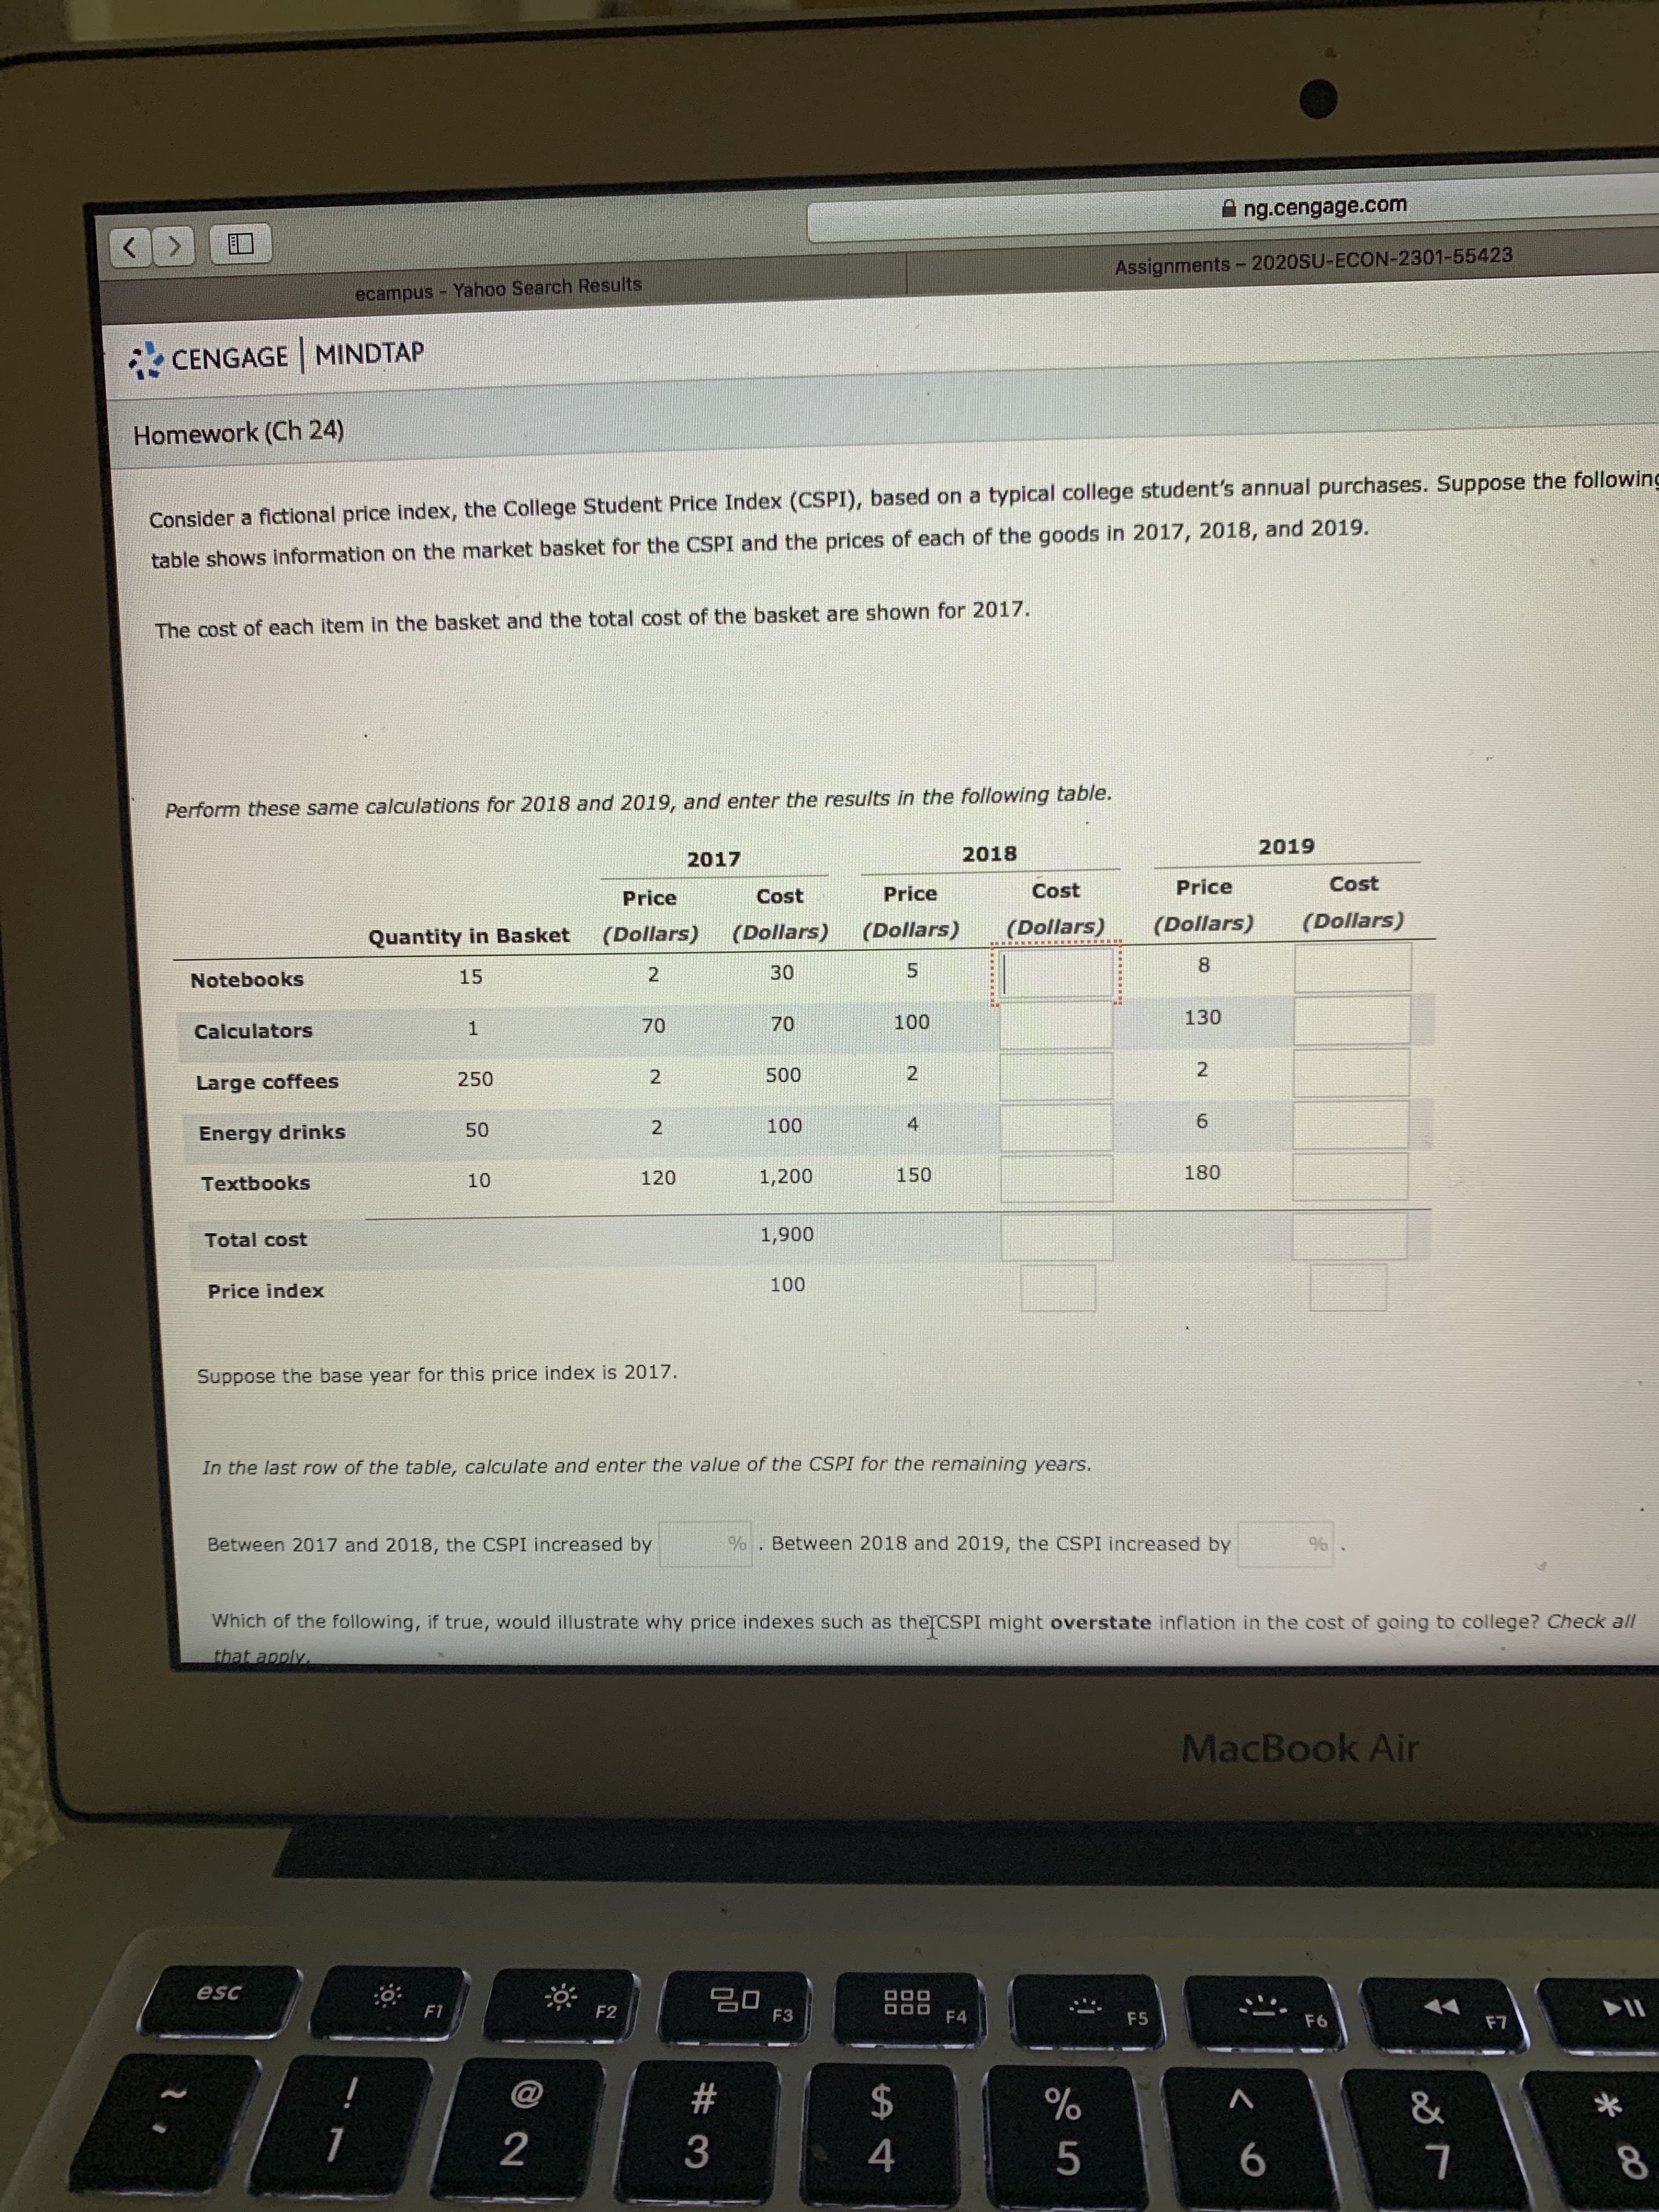
Consider a fictional price index, the College Student Price Index (CSPI), based on a typical college student's annual purchases. Suppose the following table shows information on the market basket for the CSPI and the prices of each of the goods in 2017, 2018, and 2019. The cost of each item in the basket and the total cost of the basket are shown for 2017.


Q: Consider the prices of three goods as given in the table above. Who is likely to feel like the…
A: Price of good A increases by $0.15 Price of good B increases by $0.70 Price of good C decreases by…
Q: Are people worse off when the price level rises as fast as their income? Why do people often feel…
A: Answer - In the pareto optimal condition "We have to make someone better off with out making others…
Q: always arise from measuring price levels with a fixed basket of goods and what steps can be taken to…
A: A consumer price index is a cost record, the cost of a weighted average market basket of shopper…
Q: Are people necessarily worse off when the price level rises at the same rate as their income?
A: Quantity of enterprise depends on certain criterias. It would increase if there are maximum number…
Q: what are the underlying possible reasons for a J curve
A: The curve which shows the time path of the trade balance of a country over time in the situation of…
Q: The 2008 financial crisis had a dramatic impact on the wealth of households. Since then, has…
A: Years before the financial crisis of 2007-2009, cheap credit and loose lending regulations fostered…
Q: In the last row of the table, calculate and enter the value of the CSPI for the remaining years.…
A: (I) Year 2018: Cost of notebooks = 8 x 2 = 16 Cost of calculator = 1 x 104 = 104 Cost of large…
Q: In 2019, there were 10,000 people employed, 1,000 people unemployed, and 1,500 people not in the…
A: Answer; Employed = 10,000 Unemployed = 1000 Not in the labour force = 1500 Total number…
Q: Consider a fictional price index, the College Student Price Index (CSPI), based on a typical college…
A: Given below is the table which has quantity and prices of each year. Completing the table,…
Q: According to Keynes, when the price level rises, it causes the interest rate to do what? It causes…
A: Money Demand: - The demand for money is the individual's desire to keep their assets in the form of…
Q: Consider a fictional price index, the College Student Price Index (CSPI), based on a typical college…
A: Consumer Price Index is the index that helps in ascertaining the level of inflation or deflation in…
Q: Consider a fictional price index, the College Student Price Index (CSPI), based on a typical college…
A: The cost in 2018 can be calculated by multiplying the prices in 2018 with the quantity in the…
Q: What are the underlying possible reasons for a J curve? Explain
A: The curve which shows the time path of the trade balance of a country over time in the situation of…
Q: Which of the following questions are macroeconomic questions? A. What factors determine the…
A: Meaning of Economics: The term economics refers to the situation under which there remain…
Q: The empirical evidence suggests that in the United States, the real wage rate is: Countercyclical…
A: the empirical evidence suggests that in the united states the real wage rate is - Procyclical…
Q: The Table below summarizes the nominal and real GDP information for an economy for 2013 and 2014:…
A: Given Information 2013 2014 Nominal GDP 0MR 43,000 OMR 51000 Real GDP OMR 38,700 OMR 44,300…
Q: Consider a fictional price index, the College Student Price Index (CSPI), based on a typical college…
A: A price index is a measure of relative price changes that consists of a sequence of numbers…
Q: explain and illustrate laffer curve
A: Laffer curve is given by economist Arthur Laffer which shows relation between tax rate and tax…
Q: Explain why during the short run, an increase in the price of oil will cause an increase in the…
A: Changes in the Price of the commodity may lead to changes in many economic variable which causes a…
Q: Consider a fictional price index, the College Student Price Index (CSPI), based on a typical college…
A: Cost=Quantity×Price 2017 2018 2019 Qty in basket Price Cost Price Cost Price Cost…
Q: Discuss the ways in which unemployment can be reduced on the demand side of the economy
A: Unemployment: - unemployment is that portion of the labor force that is able to do work and looking…
Q: Consider a fictional price index, the College Student Price Index (CSPI), based on a typical college…
A: PLEASE FIND THE ANSWER BELOW.
Q: The most likely explanation for why the price index is rising is because People are receiving…
A: Price indices are the methods through which the level of price increase or price decrease is gauged…
Q: Aggregate demand is an economic measurement of the total amount of demand for all finished goods and…
A: Aggregate demand is calculated by taking the sum of its four components: consumption, investment,…
Q: Calculate the unemployment rate at the end of April 2018 Calculate the number of people unemployed…
A: Hey, thank you for the question. Since there are multiple questions posted, we will answer first…
Q: Consider a fictional price index, the College Student Price Index (CSPI), based on a typical college…
A: 2017 2017 2018 2018 2019 2019 Quantity in Basket Price $ Cost $ Price $ Cost $ Price $ Cost…
Q: Using the model of business fluctuations, show the effect of the COVID-19. Recall that COVID-19 shut…
A: The condition of the covid 19 would result in a large contractionary effect of the output in the…
Q: Why is the philip's curve not applicable in today's economy
A: Meaning of Philip’s Curve: The term Philip’s curve refers to the situation under which this curve…
Q: If there is an increase in both the price level and employment, which of the following could…
A: When government build more hospitals,spending will increase,causing inflation and also jobs will be…
Q: According to our analysis of a worker's choice of how much to save for retirement using our model of…
A: Answer:- (D) An increase in the interest rate.
Q: If the price level in the economy goes up while all other factors affecting the economy remains the…
A: C is consumer spending, I is investment spending and NX is net exports.
Q: If the price level increases, what happens to the consumption function? Why?
A: The following problem has been solved as follows:
Q: College Student Price Index (CSPI), based on a typical college student’s annual purchases. Suppose…
A: CPI is measured using fixed basket of goods.
Q: What is true about equilibrium price level? a. There will be some surplus in the economy b. There…
A: Equilibrium occurs at the intersection of demand and supply curves, that is where quantity demanded…
Q: The following graph approximates business cycles in the United States from the first quarter of 1955…
A: The business cycle refers to the cyclical upward movement and downward movement in most economic…
Q: The table below shows the aggregate demand for the economy of Itera. Its potential GDP (LAS) is…
A: Since you have posted a question with multiple sub-parts, we will solve first three subparts for…
Q: From 2009 to 2019, suppose that GDP increased by 25 percent. Real GDP increased by 15%. The overall…
A: The GDP is the measure of the final and total value of the final goods and services produced within…
Q: What is the shape of a typical Hubbert Curve?
A: Hubbert's peak theory was introduced by Marion King Hubbert in 1956. The theory was first used to…
Q: Calculate the unemployment rate at the end of May 2018
A: Unemployment occurs when people who are willing to work and are actively looking for jobs cannot…
Q: Evaluate the following statement: Even if the prices of a large number of goods and services in the…
A: Gross Domestic Product (GDP) refers to the value of goods and services that are produced inside a…
Q: Current price level, labeled PL1 Current real output, labeled Y1 Full-employment output, labeled YF
A: “Since you have asked multiple questions, we will solve the first three parts of the question for…
Q: What is the diference between a real interest rate and a nominal interest rate?What is the intuition…
A: An interest rate is a rate at which a borrower (the debtor) pays interest for the use of cash…
Q: Consider a fictional price index, the College Student Price Index (CSPI), based on a typical college…
A: Consumer price index (CPI) refers tot eh calculation of weighted average of the consumption basket…
Q: Graphically illustrate how each of the following events, ceteris paribus, will affect the market for…
A:


Trending now
This is a popular solution!

Step by step
Solved in 2 steps


- Consider a fictional price index, the College Student Price Index (CSPI), based on a typical college student’s annual purchases. Suppose the following table shows information on the market basket for the CSPI and the prices of each of the goods in 2017, 2018, and 2019. The cost of each item in the basket and the total cost of the basket are shown for 2017. Perform these same calculations for 2018 and 2019, and enter the results in the following table.Consider a fictional price index, the College Student Price Index (CSPI), based on a typical college student’s annual purchases. Suppose the following table shows information on the market basket for the CSPI and the prices of each of the goods in 2017, 2018, and 2019. The cost of each item in the basket and the total cost of the basket are shown for 2017. Perform these same calculations for 2018 and 2019, and enter the results in the following table. **THE TABLE IS ATTACHED** Suppose the base year for this price index is 2017. In the last row of the table, calculate and enter the value of the CSPI for the remaining years. Between 2017 and 2018, the CSPI increased by_________%. Between 2018 and 2019, the CSPI increased by_________%. Which of the following, if true, would illustrate why price indexes such as the CSPI might overstate inflation in the cost of going to college? Check all that apply. As the price of textbooks increased, more and more students…Consider a fictional price index, the College Student Price Index (CSPI), based on a typical college student’s annual purchases. Suppose the following table shows information on the market basket for the CSPI and the prices of each of the goods in 2010, 2011, and 2012. The cost of each item in the basket and the total cost of the basket are shown for 2010. Perform these same calculations for 2011 and 2012, and enter the results in the following table. Quantity in Basket 2010 2011 2012 Price Cost Price Cost Price Cost (Dollars) (Dollars) (Dollars) (Dollars) (Dollars) (Dollars) Notebooks 15 2 30 5 8 Calculators 1 70 70 100 130 Large coffees 250 2 500 2 2 Energy drinks 50 2 100 4 6 Textbooks 10 120 1,200 150 180 Total cost 5 5 1,900 5 5 Price index 5 5 100 5 5 Suppose the base year for this price index is 2010. In the last row of the table, calculate and enter…
- Consider a fictional price index, the College Student Price Index (CSPI), based on a typical college student’s annual purchases. Suppose the following table shows information on the market basket for the CSPI and the prices of each of the goods in 2017, 2018, and 2019. The cost of each item in the basket and the total cost of the basket are shown for 2017. Perform these same calculations for 2018 and 2019, and enter the results in the following table. Quantity in Basket 2017 2018 2019 Price cost price cost Price Cost Notebooks 10 2 20 1 3 Calculators 1 50 50 54 75 Large coffees 200 1 200 1 1 Energy drinks 100 2 200 3 4 Textbooks 10 100 1,000 120 150 Total cost 1,470 Price index 100 Suppose the base year for this price index is 2017. In the last row of the table, calculate and enter the…Consider a fictional price index, the College Student Price Index (CSPI), based on a typical college student’s annual purchases. Suppose the following table shows information on the market basket for the CSPI and the prices of each of the goods in 2017, 2018, and 2019. The cost of each item in the basket and the total cost of the basket are shown for 2017. Perform these same calculations for 2018 and 2019, and enter the results in the following table. Quantity in Basket 2017 2018 2019 Price Cost Price Cost Price Cost (Dollars) (Dollars) (Dollars) (Dollars) (Dollars) (Dollars) Notebooks 8 2 16 2 4 Calculators 1 64 64 104 134 Large coffees 150 2 300 2 2 Energy drinks 40 3 120 4 5 Textbooks 10 80 800 85 105 Total cost 1,300 Price index 100 Suppose the base year for this price index is 2017. In the last row of the table, calculate and enter the…Use the following information to calculate: ______________ __2000___________________2020_________ Product_____ _P_______ Q___________P_________Q_____ Textbooks $40 100 $100 120 Hamburgers 2 200 5 250 Shirts 10 50 30 100 Computers 250 40 200 100 The changes in the cost of living between the given dates, relying on both Laspeyres and Paasche price indices. The change in the cost of living based on the Fisher price index.
- Consider the following data on the X-product: a) What was the growth rate of nominal GDP between 2010 and 2011? b) What was the growth rate of the GDP deflator between 2010 and 2011? c) What was real GDP in 2010 measured in 2005 price? d) What was real GDP in 2011 measured in 2005 price? e) What was the growth rate of real GDP between 2010 and 2011? f) Was the growth rate of nominal GDP higher or lower than the growth rate of real GDP? Explain.The following graph shows a rough approximation of historical and projected median home price is for a country for the period 2000-2024. FILL IN BLANKS.Which of the following statements is INCORRECT about the consumer price index? Question 5Answer a. It captures the weight or importance of the different goods and services in the basket chosen b. It measures the changes in the quantity of the typical goods and services that households consume c. It measures the changes in the prices of the typical goods and services that households consume d. It is a measure of inflation
- the phrase "a sustained increase in the average level of prices for goods and services in an economy over time" describes which of the following terms?Your first job after graduation is in the statistical office of the small country Exemplia, where most people are employed in olive groves and love eating olives. Based on the most important transactions in Exemplia summarised in below table, you are tasked with calculating the consumer price index with base year 2020. 2020 2021 Price Quantity Price Quantity Olives (domestic consumption) 2 2,000 2.20 2,100 Olives (export) 2 4,000 2.20 3,600 Potatoes imported 1 1,000 1 800 Government‘s purchase of pencils 0.50 10,000 1 6,000 Olive picking machines (imported) 100 10 110 10 a) Determine a suitable basket. b) Using basket from your answer to question (a), calculate the CPI for 2020 and 2021, and the inflation rate for 2021. c) Briefly discuss the most important differences between the calculation of the CPI and the GDP deflator and their consequences.Before Phelps’s work, the prevailing view was that economic policy makers faced a tradeoff between unemployment and inflation: Policies that reduced unemployment would increase inflation, and policies that reduced inflation would increase unemployment. This relationship between inflation and unemployment seemed to be supported by the data. For example, the following table shows the unemployment rate and inflation rate for the United States from 1961 to 1969. The inflation rate is measured by the percentage change in the GDP deflator. On the following graph, plot the black points (cross symbol) to show the combinations of unemployment and inflation that existed from 1961 through 1969. Plot the points in order, starting with 1961 and ending with 1969. (Hint: When you're done, place your cursor over each of the points you plotted to ensure that you've placed them on the exact coordinates you intended to.) Based on data in the table, when the inflation rate increased from 4.6% to 5.8%,…

