Consider a Poisson process with rate X= 2 and let T be the time of the first arrival. 1. Find the conditional PDF of T given that the second arrival came before time t = 1. Enter an expression in terms of A and t. 2. Find the conditional PDF of T given that the third arrival comes exactly at time t = 1.
Consider a Poisson process with rate X= 2 and let T be the time of the first arrival. 1. Find the conditional PDF of T given that the second arrival came before time t = 1. Enter an expression in terms of A and t. 2. Find the conditional PDF of T given that the third arrival comes exactly at time t = 1.

Linear Algebra: A Modern Introduction
4th Edition
ISBN:9781285463247
Author:David Poole
Publisher:David Poole
Chapter2: Systems Of Linear Equations
Section2.5: Iterative Methods For Solving Linear Systems
Problem 20EQ

Related questions
Question
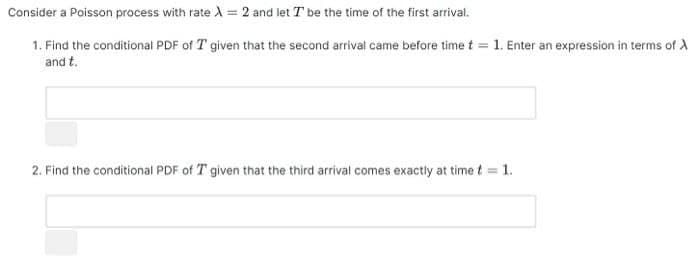
Transcribed Image Text:Consider a Poisson process with rate X= 2 and let T be the time of the first arrival.
1. Find the conditional PDF of T given that the second arrivat came before time t = 1. Enter an expression in terms of A
and t.
2. Find the conditional PDF of T given that the third arrival comes exactly at time t = 1.
Expert Solution
This question has been solved!
Explore an expertly crafted, step-by-step solution for a thorough understanding of key concepts.

This is a popular solution!

Trending now
This is a popular solution!

Step by step
Solved in 2 steps with 2 images

Recommended textbooks for you
Linear Algebra: A Modern Introduction
Algebra
ISBN:
9781285463247
Author:
David Poole
Publisher:
Cengage Learning

Trigonometry (MindTap Course List)
Trigonometry
ISBN:
9781337278461
Author:
Ron Larson
Publisher:
Cengage Learning
Linear Algebra: A Modern Introduction
Algebra
ISBN:
9781285463247
Author:
David Poole
Publisher:
Cengage Learning
Trigonometry (MindTap Course List)
Trigonometry
ISBN:
9781337278461
Author:
Ron Larson
Publisher:
Cengage Learning