Consider a value to be significantly low if its z score less than or equal to - 2 or consider a value to be significantly high if its z score is greater than or equal to 2. A test is used to assess readiness for college. In a recent year, the mean test score was 21.1 and the standard deviation was 4.7. Identify the test scores that are significantly low or significantly high. What test scores are significantly low? Select the correct answer below and fill in the answer box(es) to complete your choice. O A. Test scores that are greater than O B. Test scores that are less than - (Round to one decimal place as needed.) - (Round to one decimal place as needed.) OC. Test scores that are between and |- (Round to one decimal place as needed. Use ascending order.) What test scores are significantly high? Select the correct answer below and fill in the answer box(es) to complete your choice. O A. Test scores that are between and | (Round to one decimal place as needed. Use ascending order.) O B. Test scores that are greater than - (Round to one decimal place as needed.) OC. Test scores that are less than - (Round to one decimal place as needed.)
Consider a value to be significantly low if its z score less than or equal to - 2 or consider a value to be significantly high if its z score is greater than or equal to 2. A test is used to assess readiness for college. In a recent year, the mean test score was 21.1 and the standard deviation was 4.7. Identify the test scores that are significantly low or significantly high. What test scores are significantly low? Select the correct answer below and fill in the answer box(es) to complete your choice. O A. Test scores that are greater than O B. Test scores that are less than - (Round to one decimal place as needed.) - (Round to one decimal place as needed.) OC. Test scores that are between and |- (Round to one decimal place as needed. Use ascending order.) What test scores are significantly high? Select the correct answer below and fill in the answer box(es) to complete your choice. O A. Test scores that are between and | (Round to one decimal place as needed. Use ascending order.) O B. Test scores that are greater than - (Round to one decimal place as needed.) OC. Test scores that are less than - (Round to one decimal place as needed.)

Glencoe Algebra 1, Student Edition, 9780079039897, 0079039898, 2018
18th Edition
ISBN:9780079039897
Author:Carter
Publisher:Carter
Chapter10: Statistics
Section10.5: Comparing Sets Of Data
Problem 14PPS

Related questions
Question
113 and 118 solve both plz
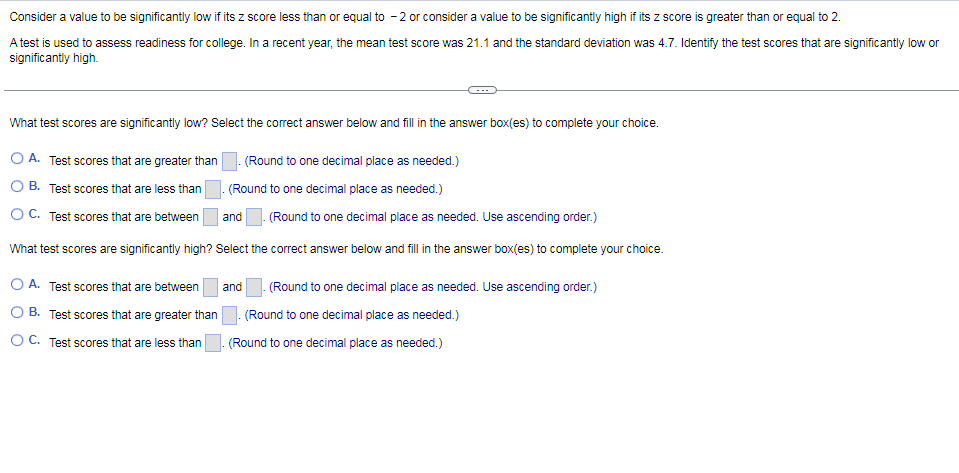
Transcribed Image Text:Consider a value to be significantly low if its z score less than or equal to - 2 or consider a value to be significantly high if its z score is greater than or equal to 2.
A test is used to assess readiness for college. In a recent year, the mean test score was 21.1 and the standard deviation was 4.7. Identify the test scores that are significantly low or
significantiy high.
What test scores are significantly low? Select the correct answer below and fill in the answer box(es) to complete your choice.
O A. Test scores that are greater than
- (Round to one decimal place as needed.)
O B. Test scores that are less than
(Round to one decimal place as needed.)
O C. Test scores that are between
and
- (Round to one decimal place as needed. Use ascending order.)
What test scores are significantly high? Select the correct answer below and fill in the answer box(es) to complete your choice.
O A. Test scores that are between
and
|- (Round to one decimal place as needed. Use ascending order.)
O B. Test scores that are greater than
. (Round to one decimal place as needed.)
O C. Test scores that are less than
. (Round to one decimal place as needed.)
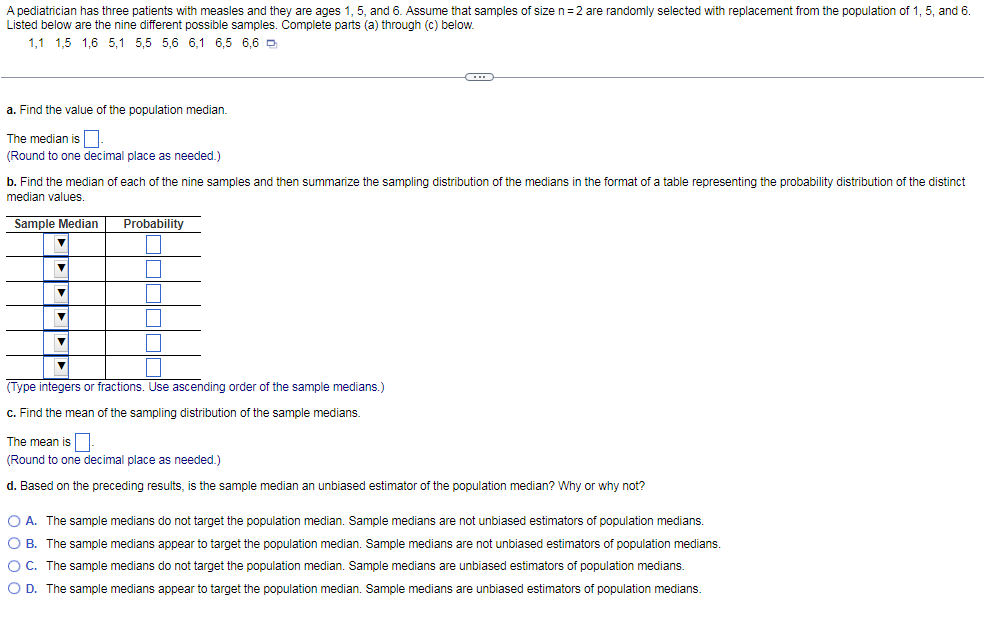
Transcribed Image Text:A pediatrician has three patients with measles and they are ages 1, 5, and 6. Assume that samples of size n=2 are randomly selected with replacement from the population of 1, 5, and 6.
Listed below are the nine different possible samples. Complete parts (a) through (c) below.
1,1 1,5 1,6 5,1 5,5 5,6 6,1 6,5 6,6 D
a. Find the value of the population median.
The median is
(Round to one decimal place as needed.)
b. Find the median of each of the nine samples and then summarize the sampling distribution of the medians in the format of a table representing the probability distribution of the distinct
median values.
Sample Median
Probability
(Type integers or fractions. Use ascending order of the sample medians.)
c. Find the mean of the sampling distribution of the sample medians.
The mean is
(Round to one decimal place as needed.)
d. Based on the preceding results, is the sample median an unbiased estimator of the population median? Why or why not?
O A. The sample medians do not target the population median. Sample medians are not unbiased estimators of population medians.
O B. The sample medians appear to target the population median. Sample medians are not unbiased estimators of population medians.
OC. The sample medians do not target the population median. Sample medians are unbiased estimators of population medians.
O D. The sample medians appear to target the population median. Sample medians are unbiased estimators of population medians.
Expert Solution
This question has been solved!
Explore an expertly crafted, step-by-step solution for a thorough understanding of key concepts.

Step by step
Solved in 3 steps with 2 images

Recommended textbooks for you
Glencoe Algebra 1, Student Edition, 9780079039897…
Algebra
ISBN:
9780079039897
Author:
Carter
Publisher:
McGraw Hill
Glencoe Algebra 1, Student Edition, 9780079039897…
Algebra
ISBN:
9780079039897
Author:
Carter
Publisher:
McGraw Hill