consider the data given and find standard deviation below Scores Comulative frequency o- 4 5-9 4 10 - 14 12 ダー 19 21 20- 24 30 25- 29 53 30 -34 66 35- 39 73
consider the data given and find standard deviation below Scores Comulative frequency o- 4 5-9 4 10 - 14 12 ダー 19 21 20- 24 30 25- 29 53 30 -34 66 35- 39 73

Glencoe Algebra 1, Student Edition, 9780079039897, 0079039898, 2018
18th Edition
ISBN:9780079039897
Author:Carter
Publisher:Carter
Chapter10: Statistics
Section10.6: Summarizing Categorical Data
Problem 31PPS

Related questions
Question
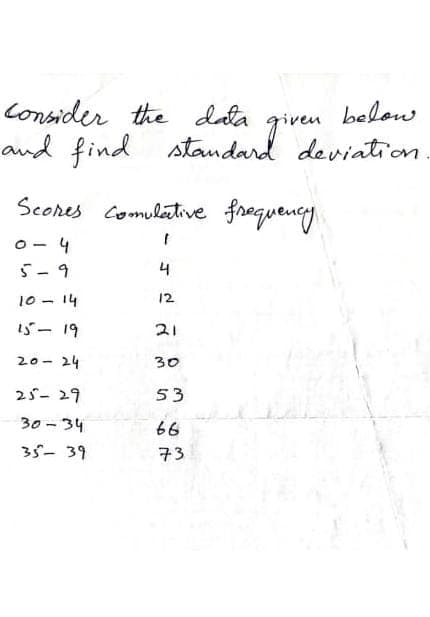
Transcribed Image Text:Consider the data
given
and find standard deviation
below
Scores Comulative frequency
4
5-9
4
10 - 14
12
『ー 19
21
20- 24
30
25- 29
53
30 - 34
66
35- 39
73
Expert Solution
This question has been solved!
Explore an expertly crafted, step-by-step solution for a thorough understanding of key concepts.

Step by step
Solved in 3 steps with 2 images

Recommended textbooks for you
Glencoe Algebra 1, Student Edition, 9780079039897…
Algebra
ISBN:
9780079039897
Author:
Carter
Publisher:
McGraw Hill
Glencoe Algebra 1, Student Edition, 9780079039897…
Algebra
ISBN:
9780079039897
Author:
Carter
Publisher:
McGraw Hill