The following table presents the scores of students in Statistics examination Frequency 2. Scores 30-39 40-49 6. 50-59 60 60 - 69 140 70-79 184 80 - 89 90-99 135 78 What does the standard deviation say about the scores of the students? Select the correct response: 99.7% of the boys have an average difference of about 14 95% of the boys have an average difference of about 14
The following table presents the scores of students in Statistics examination Frequency 2. Scores 30-39 40-49 6. 50-59 60 60 - 69 140 70-79 184 80 - 89 90-99 135 78 What does the standard deviation say about the scores of the students? Select the correct response: 99.7% of the boys have an average difference of about 14 95% of the boys have an average difference of about 14

Glencoe Algebra 1, Student Edition, 9780079039897, 0079039898, 2018
18th Edition
ISBN:9780079039897
Author:Carter
Publisher:Carter
Chapter10: Statistics
Section10.4: Distributions Of Data
Problem 19PFA

Related questions
Question
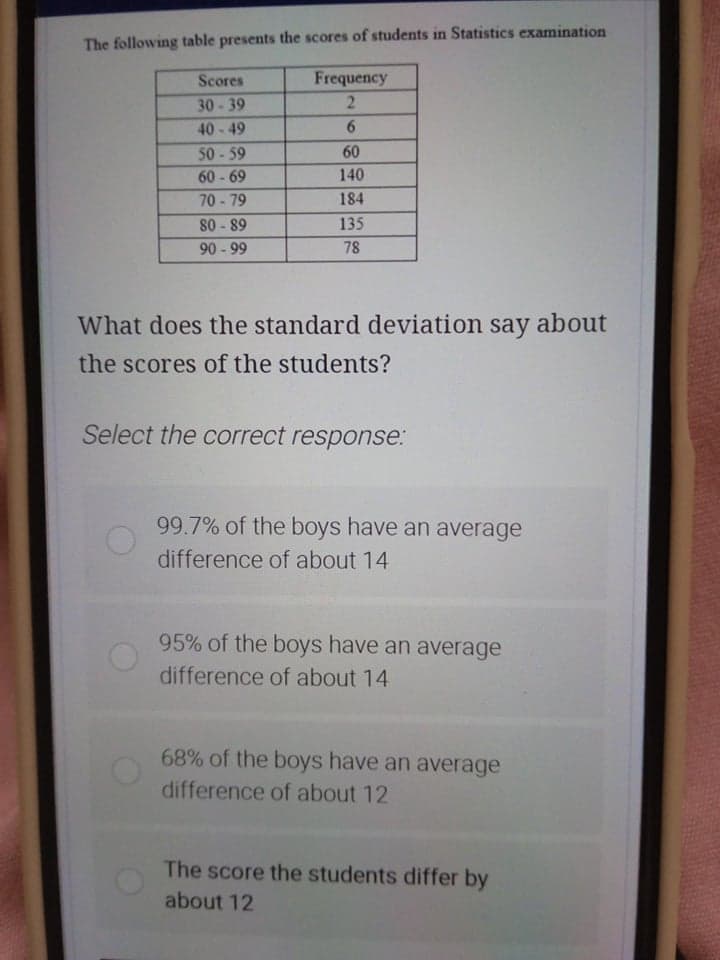
Transcribed Image Text:The following table presents the scores of students in Statistics examination
Scores
Frequency
30-39
2
40-49
6.
50-59
60
60 - 69
140
70-79
184
80-89
135
90 -99
78
What does the standard deviation say about
the scores of the students?
Select the correct response:
99.7% of the boys have an average
difference of about 14
95% of the boys have an average
difference of about 14
68% of the boys have an average
difference of about 12
The score the students differ by
about 12
Expert Solution
This question has been solved!
Explore an expertly crafted, step-by-step solution for a thorough understanding of key concepts.

Step by step
Solved in 3 steps with 2 images

Recommended textbooks for you
Glencoe Algebra 1, Student Edition, 9780079039897…
Algebra
ISBN:
9780079039897
Author:
Carter
Publisher:
McGraw Hill
Glencoe Algebra 1, Student Edition, 9780079039897…
Algebra
ISBN:
9780079039897
Author:
Carter
Publisher:
McGraw Hill