Consider the data. x, 1 3. 4 Y:4 S 6 10 12 The estimated regression equation for these data is ý 2.60 + 1.80x. (a) Compute SSE, SST, and SSR using equations SSE -E(y - ), sST - Ily, - v, and SSR - I, - . SSE 76 SST = 40 SSR = 324 (b) Compute the coefficient of determination . Comment on the goodness of tit. (For purposes of this exercise, consider a proportion large if it is at least 0.5s.) O The least squares line did not provide a good fit as a large proportion of the variability in y has been explained by the least squares line. O The least squares line did not provide a good fit as a small proportion of the variability in y has been explained by the least squares line. O The least squares ine provided a good fit as a small proportion of the variabity in y has been explained by the least squares ine The least squares line provided a good fit as a large proportion of the varability in y has been explained by the least squares line (c) Compute the sample correlation coefficient. (Round your answer to three decimal places.)
Consider the data. x, 1 3. 4 Y:4 S 6 10 12 The estimated regression equation for these data is ý 2.60 + 1.80x. (a) Compute SSE, SST, and SSR using equations SSE -E(y - ), sST - Ily, - v, and SSR - I, - . SSE 76 SST = 40 SSR = 324 (b) Compute the coefficient of determination . Comment on the goodness of tit. (For purposes of this exercise, consider a proportion large if it is at least 0.5s.) O The least squares line did not provide a good fit as a large proportion of the variability in y has been explained by the least squares line. O The least squares line did not provide a good fit as a small proportion of the variability in y has been explained by the least squares line. O The least squares ine provided a good fit as a small proportion of the variabity in y has been explained by the least squares ine The least squares line provided a good fit as a large proportion of the varability in y has been explained by the least squares line (c) Compute the sample correlation coefficient. (Round your answer to three decimal places.)

College Algebra
7th Edition
ISBN:9781305115545
Author:James Stewart, Lothar Redlin, Saleem Watson
Publisher:James Stewart, Lothar Redlin, Saleem Watson
Chapter1: Equations And Graphs
Section: Chapter Questions
Problem 10T: Olympic Pole Vault The graph in Figure 7 indicates that in recent years the winning Olympic men’s...

Related questions
Question
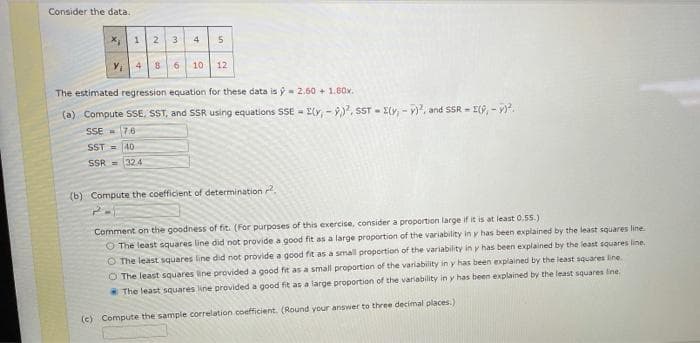
Transcribed Image Text:Consider the data,
X, 1
4
Y, 4
8 6 10 12
The estimated regression equation for these data is ý- 2.60 + 1.80x.
(a) Compute SSE, SST, and SSR using equations SSE - I(r, - ), sST - E(y, - v), and SSR = E(, - .
SSE 7.6
SST =40
SSR = 324
(b) Compute the coefficient of determination ?.
Comment on the goodness of fit. (For purposes of this exercise, consider a proportion large if it is at least 0.55.)
O The least squares line did not provide a good fit as a large proportion of the variability in y has been explained by the least squares line.
O The least squares line did not provide a good fit as a small proportion of the variability in y has been explained by the least squares line.
O The least squares line provided a good fit as a small proportion of the variability in y has been explained by the least squares line
The least squares line provided a good fit as a large proportion of the variability in y has been explained by the least squares ine.
(c) Compute the sample correlation coefficient. (Round your answer to three decimal places.)
Expert Solution
This question has been solved!
Explore an expertly crafted, step-by-step solution for a thorough understanding of key concepts.

Step by step
Solved in 2 steps with 1 images

Recommended textbooks for you
College Algebra
Algebra
ISBN:
9781305115545
Author:
James Stewart, Lothar Redlin, Saleem Watson
Publisher:
Cengage Learning

Functions and Change: A Modeling Approach to Coll…
Algebra
ISBN:
9781337111348
Author:
Bruce Crauder, Benny Evans, Alan Noell
Publisher:
Cengage Learning

Algebra & Trigonometry with Analytic Geometry
Algebra
ISBN:
9781133382119
Author:
Swokowski
Publisher:
Cengage
College Algebra
Algebra
ISBN:
9781305115545
Author:
James Stewart, Lothar Redlin, Saleem Watson
Publisher:
Cengage Learning
Functions and Change: A Modeling Approach to Coll…
Algebra
ISBN:
9781337111348
Author:
Bruce Crauder, Benny Evans, Alan Noell
Publisher:
Cengage Learning
Algebra & Trigonometry with Analytic Geometry
Algebra
ISBN:
9781133382119
Author:
Swokowski
Publisher:
Cengage