Consider the economy of Ethiopia. a. The consumption function is given by C = 200 + 0.75(Y – T). The investment function is I = 200 – 25r. Government purchases and taxes are both 100. For this economy, graph the IS curve for r ranging from 0 to 8. b. Assume the money demand function in Ethiopia is (M(P)d = Y - 100r.
Consider the economy of Ethiopia. a. The consumption function is given by C = 200 + 0.75(Y – T). The investment function is I = 200 – 25r. Government purchases and taxes are both 100. For this economy, graph the IS curve for r ranging from 0 to 8. b. Assume the money demand function in Ethiopia is (M(P)d = Y - 100r.

Chapter13: Monetary Policy: Conventional And Unconventional
Section: Chapter Questions
Problem 8TY

Related questions
Question
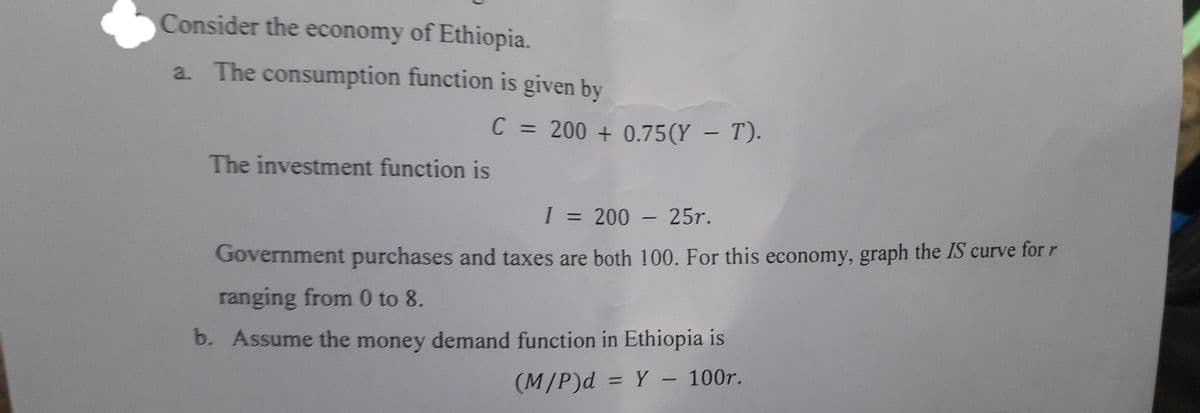
Transcribed Image Text:Consider the economy of Ethiopia.
a. The consumption function is given by
C = 200 + 0.75(Y – T).
The investment function is
I = 200 – 25r.
%3D
Government purchases and taxes are both 100. For this economy, graph the IS curve for r
ranging from 0 to 8.
b. Assume the money demand function in Ethiopia is
(M/P)d = Y – 100r.
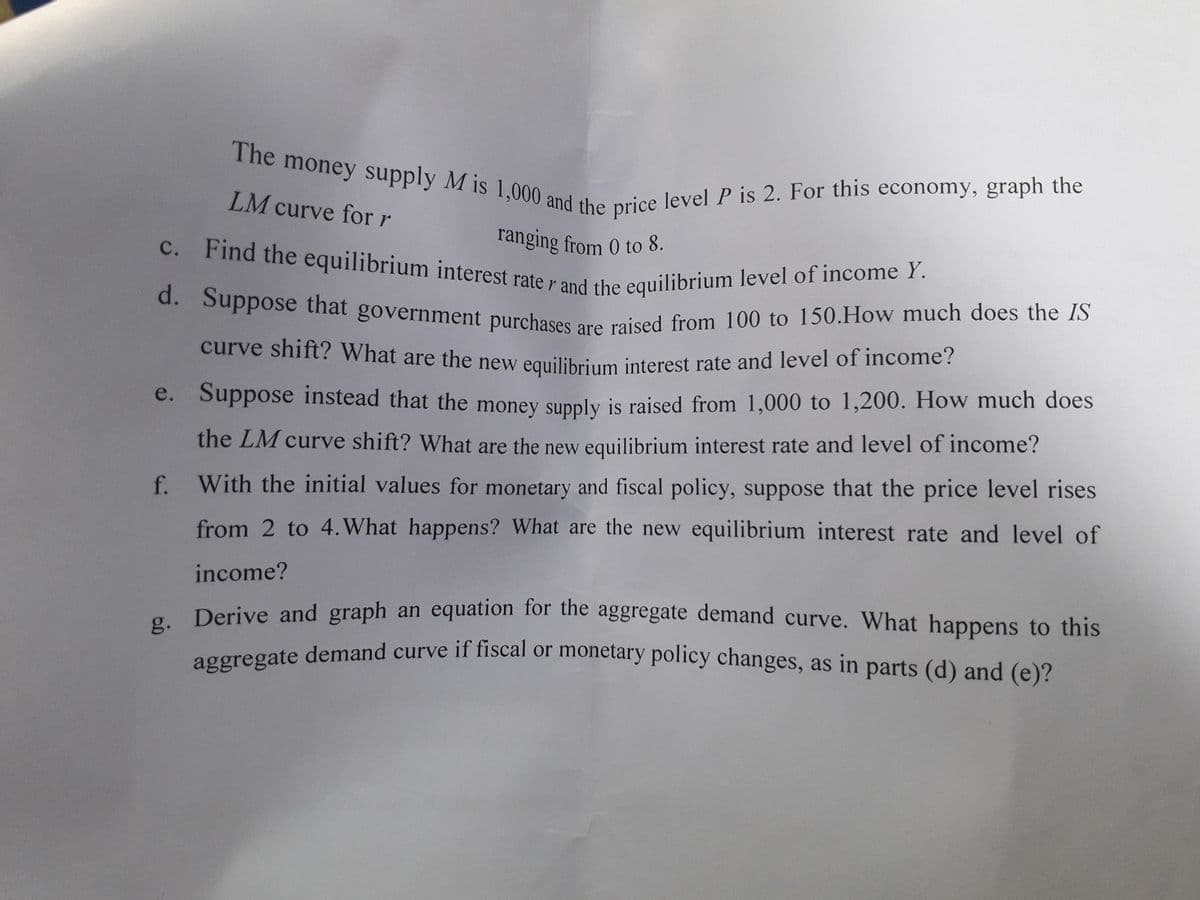
Transcribed Image Text:The money supply M is 1,000 and the price level P is 2. For this economy, graph the
d. Suppose that government purchases are raised from 100 to 150.How much does the IS
c. Find the equilibrium interest rate r and the equilibrium level of income Y.
LM curve for r
ranging from 0 to 8.
curve shift? What are the new equilibrium interest rate and level of income?
e. Suppose instead that the money supply is raised from 1,000 to 1,200. How much does
the LM curve shift? What are the new equilibrium interest rate and level of income?
f. With the initial values for monetary and fiscal policy, suppose that the price level rises
from 2 to 4.What happens? What are the new equilibrium interest rate and level of
income?
Derive and graph an equation for the aggregate demand curve. What happens to this
Rgregate demand curve if fiscal or monetary policy changes, as in parts (d) and (e)?
Expert Solution
This question has been solved!
Explore an expertly crafted, step-by-step solution for a thorough understanding of key concepts.

This is a popular solution!

Trending now
This is a popular solution!

Step by step
Solved in 3 steps with 2 images

Knowledge Booster


Learn more about
Need a deep-dive on the concept behind this application? Look no further. Learn more about this topic, economics and related others by exploring similar questions and additional content below.Recommended textbooks for you


Economics (MindTap Course List)
Economics
ISBN:
9781337617383
Author:
Roger A. Arnold
Publisher:
Cengage Learning