Consider the figures below. (1) (2) 5- 4. Use the rectangles in each graph to approximate the area of the region bounded by y = 5/x, y = 0, x 1, and x- 5. (Round your answers to three decimal places. 10.42 figure (1) x figure (2) 19 76 Describe how you could continue this process to obtain a more accurate approximation of the area. O Continually increase the height of all rectangles. O Continually decrease the number of rectangles. O Continually decrease the height of all rectangles. Continually increase the number of rectangles.
Consider the figures below. (1) (2) 5- 4. Use the rectangles in each graph to approximate the area of the region bounded by y = 5/x, y = 0, x 1, and x- 5. (Round your answers to three decimal places. 10.42 figure (1) x figure (2) 19 76 Describe how you could continue this process to obtain a more accurate approximation of the area. O Continually increase the height of all rectangles. O Continually decrease the number of rectangles. O Continually decrease the height of all rectangles. Continually increase the number of rectangles.

Calculus: Early Transcendentals
8th Edition
ISBN:9781285741550
Author:James Stewart
Publisher:James Stewart
Chapter1: Functions And Models
Section: Chapter Questions
Problem 1RCC: (a) What is a function? What are its domain and range? (b) What is the graph of a function? (c) How...

Related questions
Question
I’m begging, their not hard, please answer both questions; thanks!!
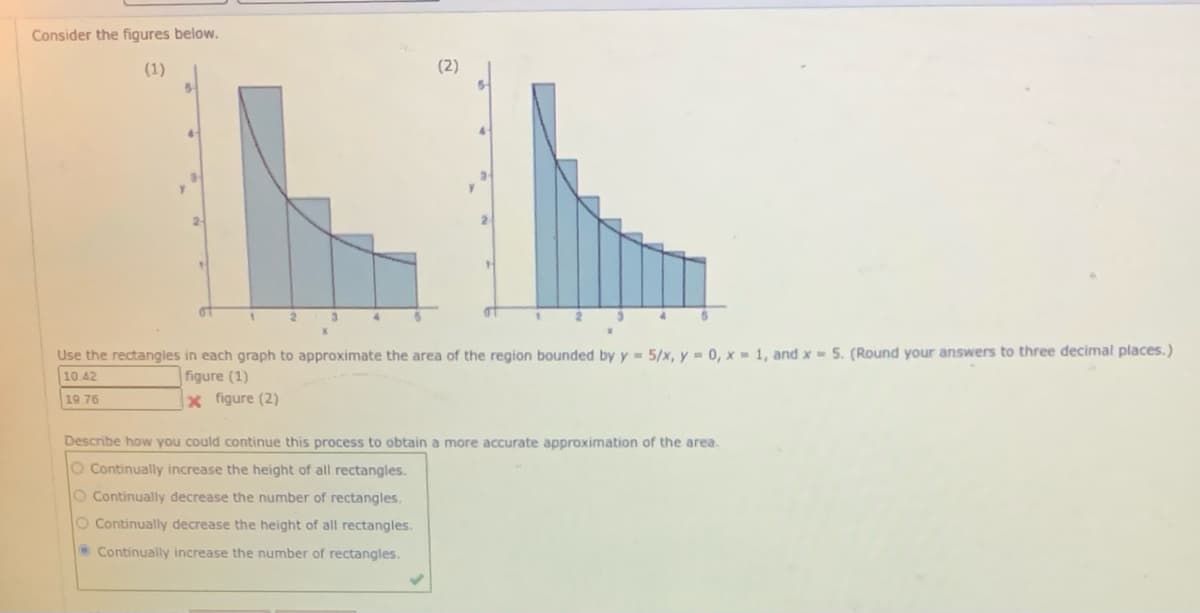
Transcribed Image Text:Consider the figures below.
(1)
(2)
2-
Use the rectangles in each graph to approximate the area of the region bounded by y 5/x, y = 0, x - 1, and x- 5. (Round your answers to three decimal places.)
10.42
figure (1)
x figure (2)
19 76
Describe how you could continue this process to obtain a more accurate approximation of the area.
O Continually increase the height of all rectangles.
O Continually decrease the number of rectangles.
O Continually decrease the height of all rectangles.
• Continually increase the number of rectangles.
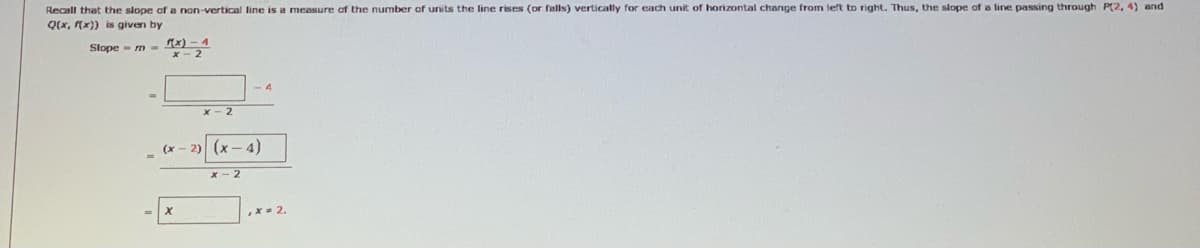
Transcribed Image Text:Recall that the slope af a non-vertical line is a measure of the number of units the line rises (or falls) vertically for each unit of horizontal change from left to right. Thus, the slope of a line passing through P(2, 4) and
Q(x, (x)) is given by
Slope - m - x) - 4
x- 2
-4
x - 2
(x
2)
(x- 4)
2
,x- 2.
Expert Solution
This question has been solved!
Explore an expertly crafted, step-by-step solution for a thorough understanding of key concepts.

This is a popular solution!

Trending now
This is a popular solution!

Step by step
Solved in 3 steps with 2 images

Recommended textbooks for you
Calculus: Early Transcendentals
Calculus
ISBN:
9781285741550
Author:
James Stewart
Publisher:
Cengage Learning

Thomas' Calculus (14th Edition)
Calculus
ISBN:
9780134438986
Author:
Joel R. Hass, Christopher E. Heil, Maurice D. Weir
Publisher:
PEARSON

Calculus: Early Transcendentals (3rd Edition)
Calculus
ISBN:
9780134763644
Author:
William L. Briggs, Lyle Cochran, Bernard Gillett, Eric Schulz
Publisher:
PEARSON
Calculus: Early Transcendentals
Calculus
ISBN:
9781285741550
Author:
James Stewart
Publisher:
Cengage Learning
Thomas' Calculus (14th Edition)
Calculus
ISBN:
9780134438986
Author:
Joel R. Hass, Christopher E. Heil, Maurice D. Weir
Publisher:
PEARSON
Calculus: Early Transcendentals (3rd Edition)
Calculus
ISBN:
9780134763644
Author:
William L. Briggs, Lyle Cochran, Bernard Gillett, Eric Schulz
Publisher:
PEARSON

Calculus: Early Transcendentals
Calculus
ISBN:
9781319050740
Author:
Jon Rogawski, Colin Adams, Robert Franzosa
Publisher:
W. H. Freeman


Calculus: Early Transcendental Functions
Calculus
ISBN:
9781337552516
Author:
Ron Larson, Bruce H. Edwards
Publisher:
Cengage Learning