Consider the first four entries presented in the table below, which represent one estimate of the world's population levels over the second millennium AD: Population Year AD (1) size x (in billions) 1000 0.31 1250 0.40 1500 0.50 1750 0.79 Provide a semi-log plot of the points (t, In x) and find and graph the best-fitting line through these points
Consider the first four entries presented in the table below, which represent one estimate of the world's population levels over the second millennium AD: Population Year AD (1) size x (in billions) 1000 0.31 1250 0.40 1500 0.50 1750 0.79 Provide a semi-log plot of the points (t, In x) and find and graph the best-fitting line through these points

Algebra & Trigonometry with Analytic Geometry
13th Edition
ISBN:9781133382119
Author:Swokowski
Publisher:Swokowski
Chapter7: Analytic Trigonometry
Section7.6: The Inverse Trigonometric Functions
Problem 91E

Related questions
Question
Question 46
Transcribed Image Text:istitutional Correlates.
Science 194,
368
581
pp. 732–734.
385
609
360
557
346
433
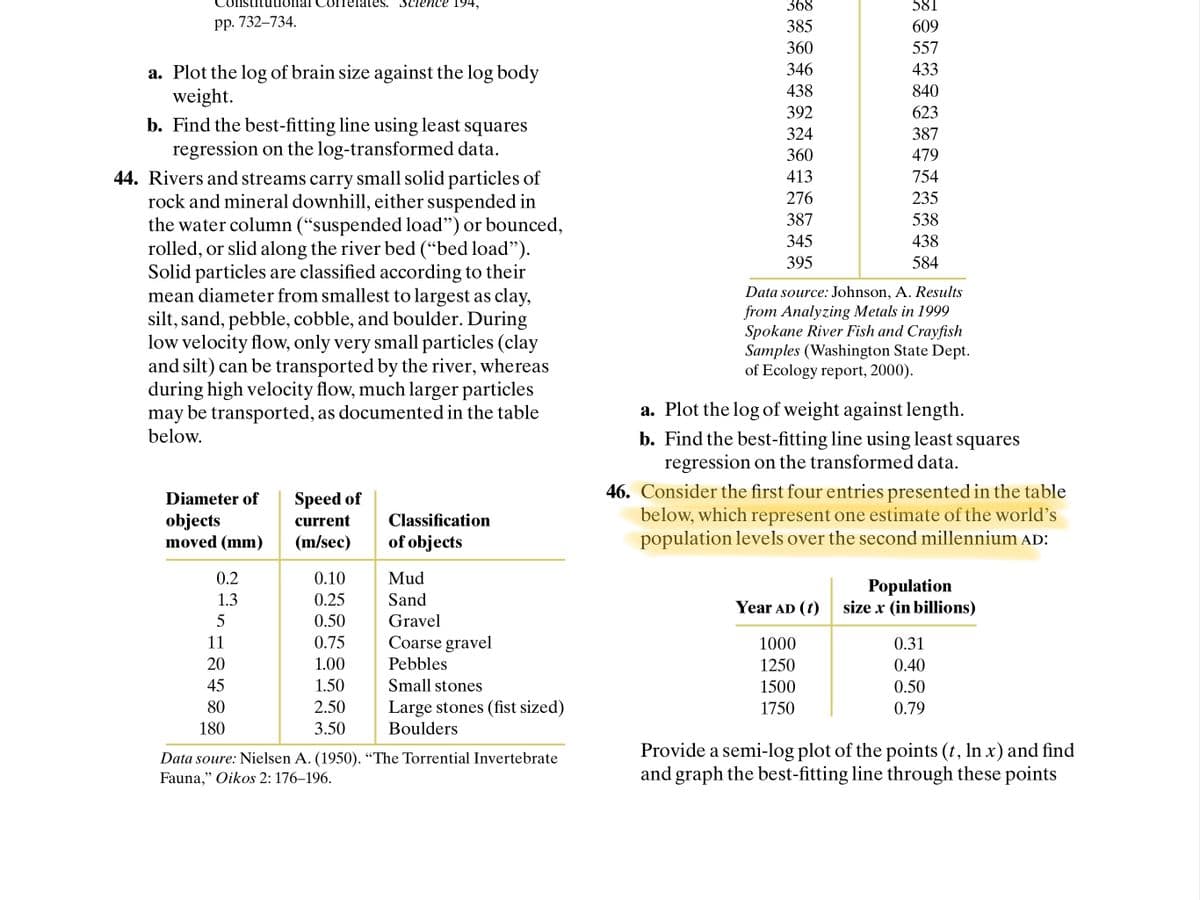
a. Plot the log of brain size against the log body
weight.
b. Find the best-fitting line using least squares
regression on the log-transformed data.
44. Rivers and streams carry small solid particles of
rock and mineral downhill, either suspended in
the water column (“suspended load") or bounced,
rolled, or slid along the river bed (“bed load").
Solid particles are classified according to their
mean diameter from smallest to largest as clay,
silt, sand, pebble, cobble, and boulder. During
low velocity flow, only very small particles (clay
and silt) can be transported by the river, whereas
during high velocity flow, much larger particles
may be transported, as documented in the table
below.
438
840
392
623
324
387
360
479
413
754
276
235
387
538
345
438
395
584
Data source: Johnson, A. Results
from Analyzing Metals in 1999
Spokane River Fish and Crayfish
Samples (Washington State Dept.
of Ecology report, 2000).
a. Plot the log of weight against length.
b. Find the best-fitting line using least squares
regression on the transformed data.
46. Consider the first four entries presented in the table
below, which represent one estimate of the world's
population levels over the second millennium AD:
Diameter of
Speed of
objects
moved (mm)
current
Classification
(m/sec)
of objects
0.2
0.10
Mud
Population
size x (in billions)
1.3
0.25
Sand
Year AD (t)
0.50
Gravel
11
0.75
Coarse gravel
1000
0.31
20
1.00
Pebbles
1250
0.40
45
1.50
Small stones
1500
0.50
80
2.50
Large stones (fist sized)
1750
0.79
180
3.50
Boulders
Data soure: Nielsen A. (1950). “The Torrential Invertebrate
Fauna," Oikos 2: 176–196.
Provide a semi-log plot of the points (t, In x) and find
and graph the best-fitting line through these points
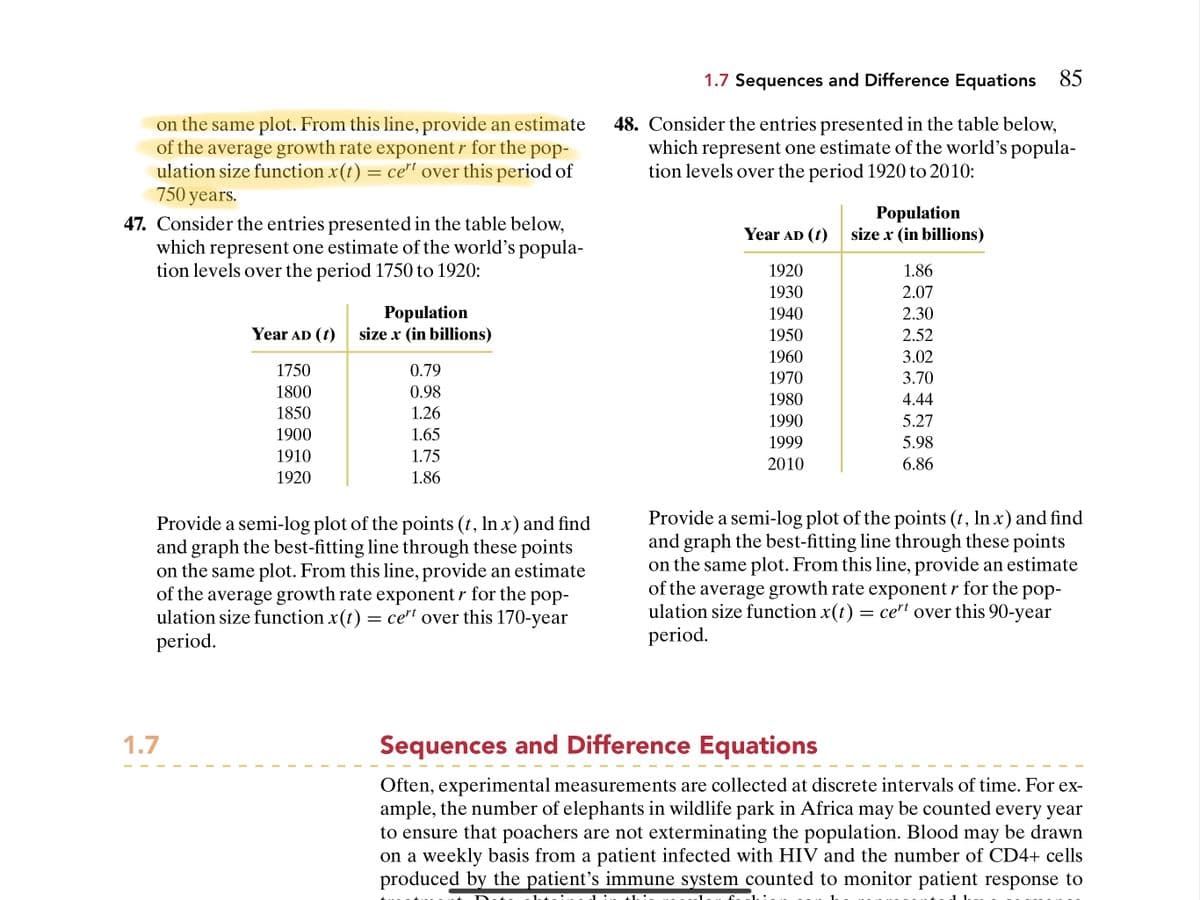
Transcribed Image Text:1.7 Sequences and Difference Equations 85
on the same plot. From this line, provide an estimate
of the average growth rate exponent r for the pop-
ulation size function x(t) = ce"' over this period of
750 years.
48. Consider the entries presented in the table below,
which represent one estimate of the world's popula-
tion levels over the period 1920 to 2010:
Population
size x (in billions)
47. Consider the entries presented in the table below,
which represent one estimate of the world's popula-
tion levels over the period 1750 to 1920:
Year AD (t)
1920
1.86
1930
2.07
Population
size x (in billions)
1940
2.30
Year AD (t)
1950
2.52
1960
3.02
1750
0.79
1970
3.70
1800
0.98
1980
4.44
1850
1.26
1990
5.27
1900
1.65
1999
5.98
1910
1.75
2010
6.86
1920
1.86
Provide a semi-log plot of the points (t, In x) and find
and graph the best-fitting line through these points
on the same plot. From this line, provide an estimate
of the average growth rate exponent r for the pop-
ulation size function x(t) = ce'' over this 170-year
period.
Provide a semi-log plot of the points (t, In x) and find
and graph the best-fitting line through these points
on the same plot. From this line, provide an estimate
of the average growth rate exponent r for the pop-
ulation size function x(t) = ce"' over this 90-year
period.
1.7
Sequences and Difference Equations
Often, experimental measurements are collected at discrete intervals of time. For ex-
ample, the number of elephants in wildlife park in Africa may be counted every year
to ensure that poachers are not exterminating the population. Blood may be drawn
on a weekly basis from a patient infected with HIV and the number of CD4+ cells
produced by the patient's immune system counted to monitor patient response to
Expert Solution
This question has been solved!
Explore an expertly crafted, step-by-step solution for a thorough understanding of key concepts.

This is a popular solution!

Trending now
This is a popular solution!

Step by step
Solved in 2 steps with 1 images

Recommended textbooks for you
Algebra & Trigonometry with Analytic Geometry
Algebra
ISBN:
9781133382119
Author:
Swokowski
Publisher:
Cengage

Linear Algebra: A Modern Introduction
Algebra
ISBN:
9781285463247
Author:
David Poole
Publisher:
Cengage Learning
Algebra & Trigonometry with Analytic Geometry
Algebra
ISBN:
9781133382119
Author:
Swokowski
Publisher:
Cengage
Linear Algebra: A Modern Introduction
Algebra
ISBN:
9781285463247
Author:
David Poole
Publisher:
Cengage Learning