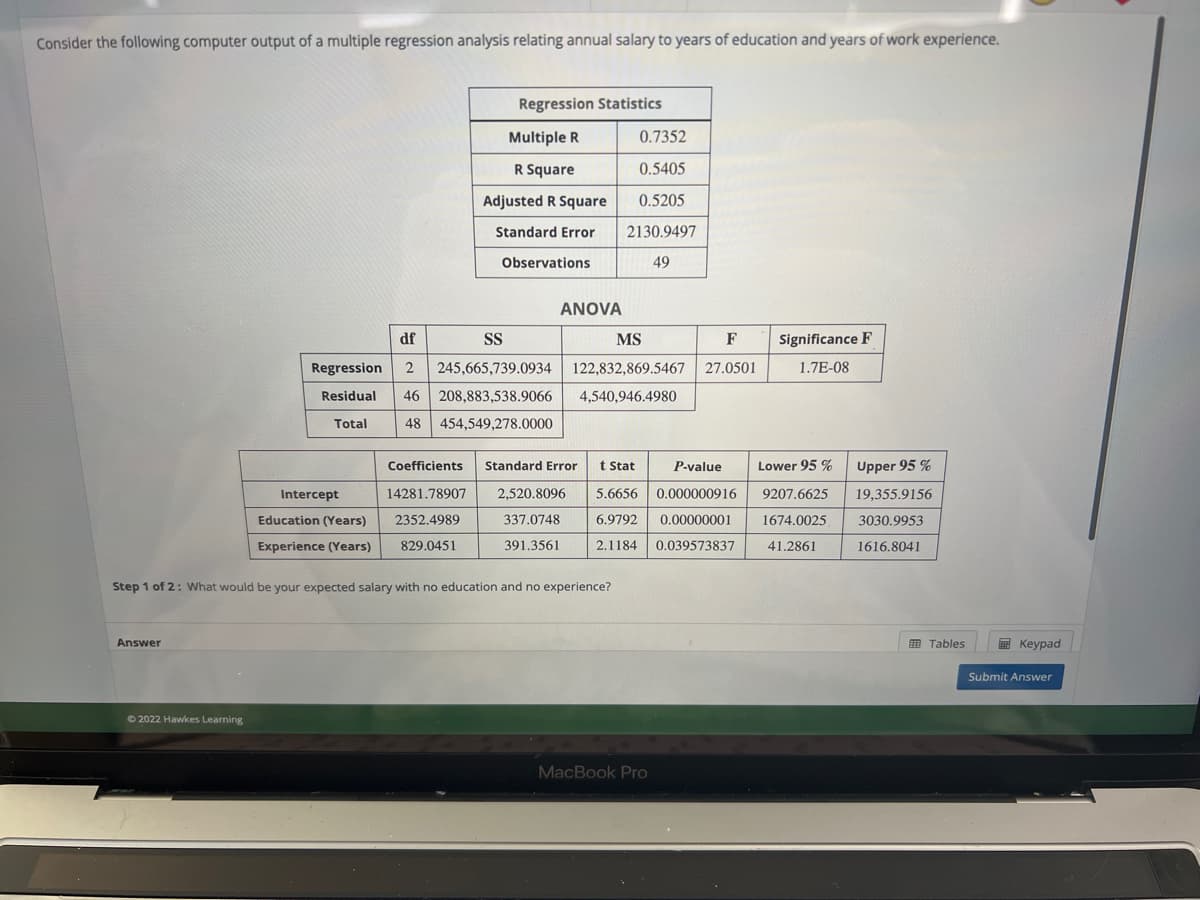
Consider the following computer output of a multiple regression analysis relating annual salary to years of education and years of work experience. Answer Regression Statistics Multiple R R Square Adjusted R Square Standard Error Ⓒ2022 Hawkes Learning Observations ANOVA 0.7352 0.5405 0.5205 2130.9497 49 df SS MS F Regression 2 245,665,739.0934 122,832,869.5467 27.0501 Residual 46 208,883,538.9066 4,540,946.4980 Total 48 454,549,278.0000 Step 1 of 2: What would be your expected salary with no education and no experience? Coefficients Standard Error t Stat Intercept 14281.78907 2,520.8096 Education (Years) 2352.4989 337.0748 Experience (Years) 829.0451 391.3561 P-value Lower 95 % 5.6656 0.000000916 9207.6625 6.9792 0.00000001 1674.0025 2.1184 0.039573837 41.2861 Significance F 1.7E-08 MacBook Pro Upper 95 % 19,355.9156 3030.9953 1616.8041 Tables Keypad Submit Answer
Consider the following computer output of a multiple regression analysis relating annual salary to years of education and years of work experience. Answer Regression Statistics Multiple R R Square Adjusted R Square Standard Error Ⓒ2022 Hawkes Learning Observations ANOVA 0.7352 0.5405 0.5205 2130.9497 49 df SS MS F Regression 2 245,665,739.0934 122,832,869.5467 27.0501 Residual 46 208,883,538.9066 4,540,946.4980 Total 48 454,549,278.0000 Step 1 of 2: What would be your expected salary with no education and no experience? Coefficients Standard Error t Stat Intercept 14281.78907 2,520.8096 Education (Years) 2352.4989 337.0748 Experience (Years) 829.0451 391.3561 P-value Lower 95 % 5.6656 0.000000916 9207.6625 6.9792 0.00000001 1674.0025 2.1184 0.039573837 41.2861 Significance F 1.7E-08 MacBook Pro Upper 95 % 19,355.9156 3030.9953 1616.8041 Tables Keypad Submit Answer

Glencoe Algebra 1, Student Edition, 9780079039897, 0079039898, 2018
18th Edition
ISBN:9780079039897
Author:Carter
Publisher:Carter
Chapter4: Equations Of Linear Functions
Section4.6: Regression And Median-fit Lines
Problem 4GP

Related questions
Question
100%
Please help asap
Transcribed Image Text:Consider the following computer output of a multiple regression analysis relating annual salary to years of education and years of work experience.
Answer
Regression Statistics
Multiple R
R Square
Adjusted R Square
Standard Error
Ⓒ2022 Hawkes Learning
Observations
ANOVA
0.7352
0.5405
0.5205
2130.9497
49
df
SS
MS
F
Regression 2 245,665,739.0934 122,832,869.5467 27.0501
Residual 46 208,883,538.9066 4,540,946.4980
Total
48 454,549,278.0000
Step 1 of 2: What would be your expected salary with no education and no experience?
Coefficients Standard Error t Stat
Intercept
14281.78907 2,520.8096
Education (Years) 2352.4989
337.0748
Experience (Years) 829.0451
391.3561
P-value Lower 95 %
5.6656 0.000000916 9207.6625
6.9792 0.00000001 1674.0025
2.1184 0.039573837 41.2861
Significance F
1.7E-08
MacBook Pro
Upper 95 %
19,355.9156
3030.9953
1616.8041
Tables
Keypad
Submit Answer
Expert Solution
This question has been solved!
Explore an expertly crafted, step-by-step solution for a thorough understanding of key concepts.

Step by step
Solved in 2 steps

Recommended textbooks for you
Glencoe Algebra 1, Student Edition, 9780079039897…
Algebra
ISBN:
9780079039897
Author:
Carter
Publisher:
McGraw Hill

Functions and Change: A Modeling Approach to Coll…
Algebra
ISBN:
9781337111348
Author:
Bruce Crauder, Benny Evans, Alan Noell
Publisher:
Cengage Learning
Glencoe Algebra 1, Student Edition, 9780079039897…
Algebra
ISBN:
9780079039897
Author:
Carter
Publisher:
McGraw Hill
Functions and Change: A Modeling Approach to Coll…
Algebra
ISBN:
9781337111348
Author:
Bruce Crauder, Benny Evans, Alan Noell
Publisher:
Cengage Learning