Consider the following data for a dependent variable y and two independent variables, ₁ and ₂. The estimated regression equation for these data is -13.41+1.96₁ +4.41₂ Here SST 15,092.1, SSR-13,423.3, 0.2986, and 4 = 1.1589. a. Test for a significant relationship among ₁, 2, and y. Use α = 0.05. F-132.72 (to 2 decimals) The p-value is less than 0.01 V ta 0.05, the overall model is significant b. Is B₁ significant? Use a = 0.05 (to 2 decimals). Use t table. 8188.34 31 30 47 25 50 40 52 74 36 60 76 2₂ 13 11 17 16 5 20 8 12 14 16 y 95 109 112 178 95 175 171 118 142 212
Consider the following data for a dependent variable y and two independent variables, ₁ and ₂. The estimated regression equation for these data is -13.41+1.96₁ +4.41₂ Here SST 15,092.1, SSR-13,423.3, 0.2986, and 4 = 1.1589. a. Test for a significant relationship among ₁, 2, and y. Use α = 0.05. F-132.72 (to 2 decimals) The p-value is less than 0.01 V ta 0.05, the overall model is significant b. Is B₁ significant? Use a = 0.05 (to 2 decimals). Use t table. 8188.34 31 30 47 25 50 40 52 74 36 60 76 2₂ 13 11 17 16 5 20 8 12 14 16 y 95 109 112 178 95 175 171 118 142 212

Functions and Change: A Modeling Approach to College Algebra (MindTap Course List)
6th Edition
ISBN:9781337111348
Author:Bruce Crauder, Benny Evans, Alan Noell
Publisher:Bruce Crauder, Benny Evans, Alan Noell
Chapter5: A Survey Of Other Common Functions
Section5.6: Higher-degree Polynomials And Rational Functions
Problem 1TU: The following fictitious table shows kryptonite price, in dollar per gram, t years after 2006. t=...

Related questions
Question
100%
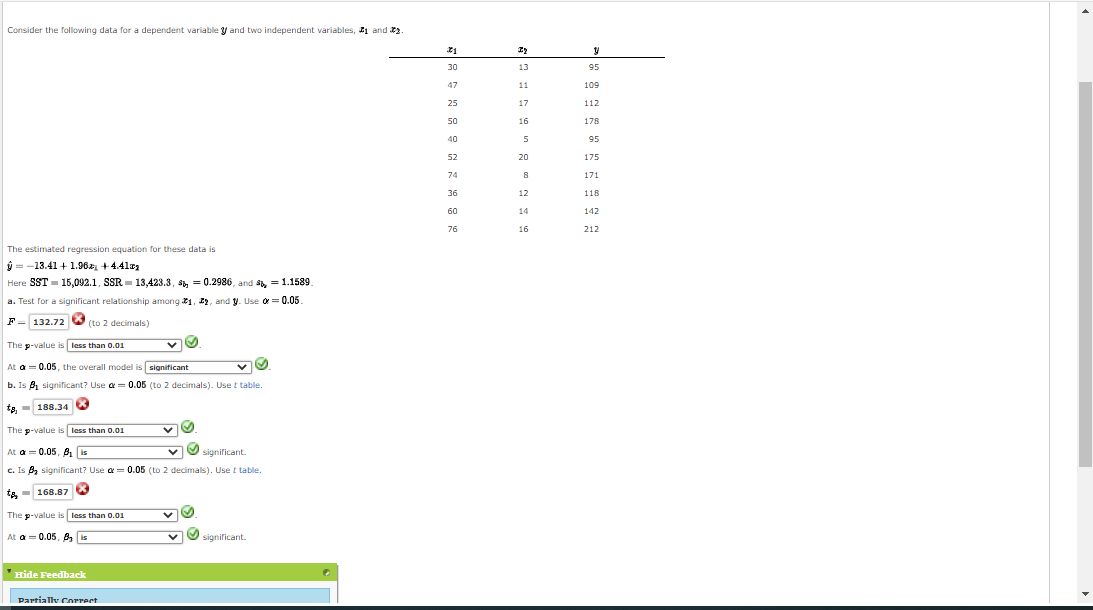
Transcribed Image Text:Consider the following data for a dependent variable y and two independent variables, 1 and 2.
The estimated regression equation for these data is
-13.41+ 1.96 +4.41x2
Here SST 15,092.1, SSR 13,423.3, 0.2986, and 8,1.1589
a. Test for a significant relationship among 1, 2, and y. Use = 0.05.
F 132.72
X (to 2 decimals)
The p-value is less than 0.01
At a = 0.05, the overall model is significant
✓
b. Is B₁ significant? Use a = 0.05 (to 2 decimals). Use t table.
ta, 188.34
The p-value is less than 0.01
✔
At a 0.05, B₁ is
✓✓ significant.
c. Is B significant? Use a = 0.05 (to 2 decimals). Use t table.
*
ta=168.87
The p-value is less than 0.01
VO
At a = 0.05, B₂ is
V
significant.
Hide Feedback
Partially Correct
21
30
47
25
50
40
52
74
36
60
76
2₂
13
11
17
16
5
20
8
12
14
16
y
95
109
112
178
95
175
171
118
142
212
Expert Solution
This question has been solved!
Explore an expertly crafted, step-by-step solution for a thorough understanding of key concepts.

Step by step
Solved in 2 steps

Recommended textbooks for you
Functions and Change: A Modeling Approach to Coll…
Algebra
ISBN:
9781337111348
Author:
Bruce Crauder, Benny Evans, Alan Noell
Publisher:
Cengage Learning
Functions and Change: A Modeling Approach to Coll…
Algebra
ISBN:
9781337111348
Author:
Bruce Crauder, Benny Evans, Alan Noell
Publisher:
Cengage Learning