Consider the following data for two variables, x and y. x 22 24 26 30 35 40 y 13 20 34 35 40 36 (a) Develop an estimated regression equation for the data of the form = b + b.x. (Round bo to one decimal place and b, to three decimal places.) ŷ= (b) Use the results from part (a) to test for a significant relationship between x and y. Use a = 0.05. Find the value of the test statistic. (Round your answer to two decimal places.) F= Find the p-value. (Round your answer to three decimal places.) p-value=[ Is the relationship between x and y significant? O Yes, the relationship is significant. O No, the relationship is not significant. (c) Develop a scatter diagram for the data. y y 45 45 40 40 35 . 35- 30 30- 25 25 20 20 15 15 10 10 35 O 5+ 0 20 . 25 30 40 45 X DO 5- 0 of 20 . 25 30 35 . 40 45 X 45 40 35 30 25 20 15- 10 @O 5- 0 20 . . 25 30 35 40 X 45 y 45 T 40 35 30 25 20+ 15 10- 5- of 20 . . 25 30 35 40 45 x Ⓡ
Consider the following data for two variables, x and y. x 22 24 26 30 35 40 y 13 20 34 35 40 36 (a) Develop an estimated regression equation for the data of the form = b + b.x. (Round bo to one decimal place and b, to three decimal places.) ŷ= (b) Use the results from part (a) to test for a significant relationship between x and y. Use a = 0.05. Find the value of the test statistic. (Round your answer to two decimal places.) F= Find the p-value. (Round your answer to three decimal places.) p-value=[ Is the relationship between x and y significant? O Yes, the relationship is significant. O No, the relationship is not significant. (c) Develop a scatter diagram for the data. y y 45 45 40 40 35 . 35- 30 30- 25 25 20 20 15 15 10 10 35 O 5+ 0 20 . 25 30 40 45 X DO 5- 0 of 20 . 25 30 35 . 40 45 X 45 40 35 30 25 20 15- 10 @O 5- 0 20 . . 25 30 35 40 X 45 y 45 T 40 35 30 25 20+ 15 10- 5- of 20 . . 25 30 35 40 45 x Ⓡ

Functions and Change: A Modeling Approach to College Algebra (MindTap Course List)
6th Edition
ISBN:9781337111348
Author:Bruce Crauder, Benny Evans, Alan Noell
Publisher:Bruce Crauder, Benny Evans, Alan Noell
Chapter5: A Survey Of Other Common Functions
Section5.6: Higher-degree Polynomials And Rational Functions
Problem 1TU: The following fictitious table shows kryptonite price, in dollar per gram, t years after 2006. t=...

Related questions
Question
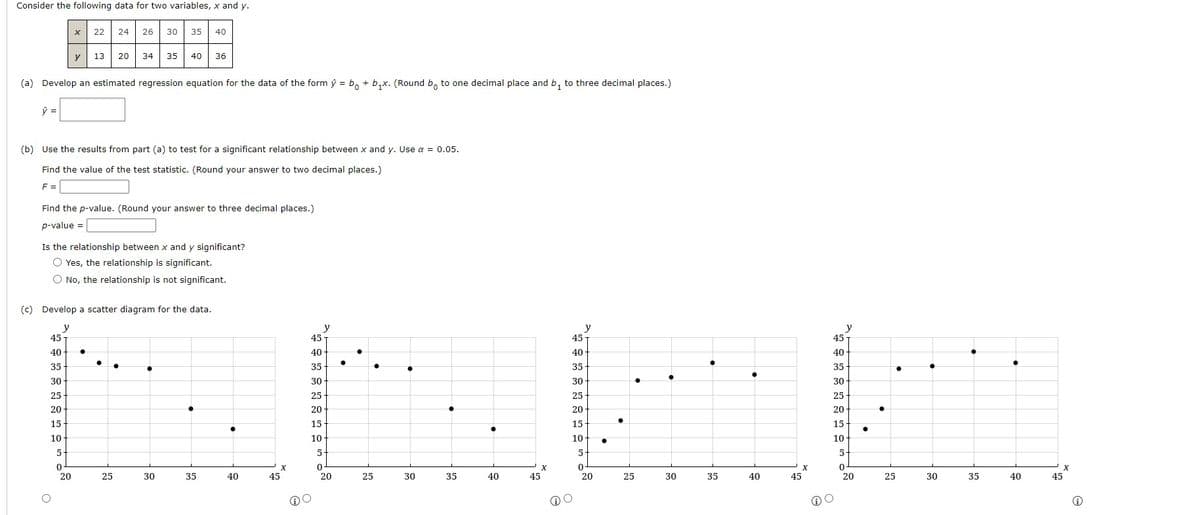
Transcribed Image Text:Consider the following data for two variables, x and y.
X
22 24 26 30
35 40
y
13 20 34 35 40 36
(a) Develop an estimated regression equation for the data of the form ý = bo + b₁x. (Round bo to one decimal place and b₁ to three decimal places.)
ŷ =
(b) Use the results from part (a) to test for a significant relationship between x and y. Use α = 0.05.
Find the value of the test statistic. (Round your answer to two decimal places.)
F =
Find the p-value. (Round your answer to three decimal places.)
p-value =
Is the relationship between x and y significant?
O Yes, the relationship is significant.
O No, the relationship is not significant.
(c) Develop a scatter diagram for the data.
y
y
y
45
45 T
40 ●
40
35
35
30
30
25
25
20
20
15
15
10
10
5
0
5
0
20
25
30
35
●
40
45
X
8
20
25
30
35
40
45
X
45
40
35
30
25
20
15
10
5
0
O
20
●
●
25
30
35
40
45
X
y
45
40
35
30
25
20
15
10
5
0
20
•
●
25
·
30
35
●
40
X
45
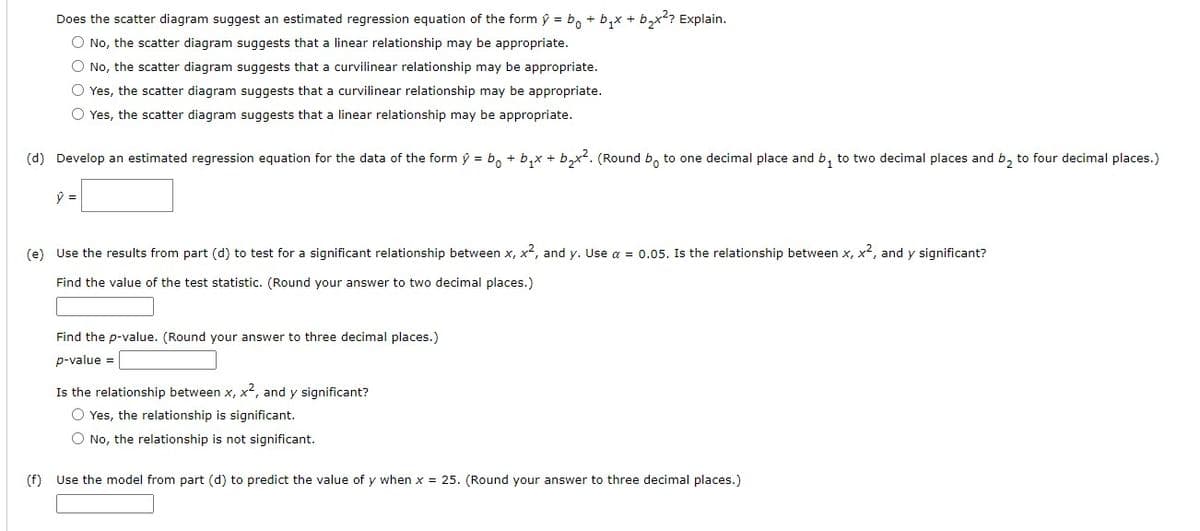
Transcribed Image Text:Does the scatter diagram suggest an estimated regression equation of the form ý = b + b₁x + b₂x²? Explain.
O No, the scatter diagram suggests that a linear relationship may be appropriate.
O No, the scatter diagram suggests that a curvilinear relationship may be appropriate.
O Yes, the scatter diagram suggests that a curvilinear relationship may be appropriate.
O Yes, the scatter diagram suggests that a linear relationship may be appropriate.
(d) Develop an estimated regression equation for the data of the form ý = b + b₁x + b₂x². (Round bo to one decimal place and b₁ to two decimal places and b₂ to four decimal places.)
(e) Use the results from part (d) to test for a significant relationship between x, x², and y. Use a = 0.05. Is the relationship between x, x², and y significant?
Find the value of the test statistic. (Round your answer to two decimal places.)
Find the p-value. (Round your answer to three decimal places.)
p-value =
Is the relationship between x, x², and y significant?
O Yes, the relationship is significant.
O No, the relationship is not significant.
(f)
Use the model from part (d) to predict the value of y when x = 25. (Round your answer to three decimal places.)
Expert Solution
This question has been solved!
Explore an expertly crafted, step-by-step solution for a thorough understanding of key concepts.

This is a popular solution!

Trending now
This is a popular solution!

Step by step
Solved in 7 steps with 2 images

Recommended textbooks for you
Functions and Change: A Modeling Approach to Coll…
Algebra
ISBN:
9781337111348
Author:
Bruce Crauder, Benny Evans, Alan Noell
Publisher:
Cengage Learning
Functions and Change: A Modeling Approach to Coll…
Algebra
ISBN:
9781337111348
Author:
Bruce Crauder, Benny Evans, Alan Noell
Publisher:
Cengage Learning