Consider the following data to select its correspondence box and whisker plots from the below: 1 3 4 7 7 8 9. 10 19 35
Consider the following data to select its correspondence box and whisker plots from the below: 1 3 4 7 7 8 9. 10 19 35

Functions and Change: A Modeling Approach to College Algebra (MindTap Course List)
6th Edition
ISBN:9781337111348
Author:Bruce Crauder, Benny Evans, Alan Noell
Publisher:Bruce Crauder, Benny Evans, Alan Noell
Chapter5: A Survey Of Other Common Functions
Section5.3: Modeling Data With Power Functions
Problem 6E: Urban Travel Times Population of cities and driving times are related, as shown in the accompanying...

Related questions
Question
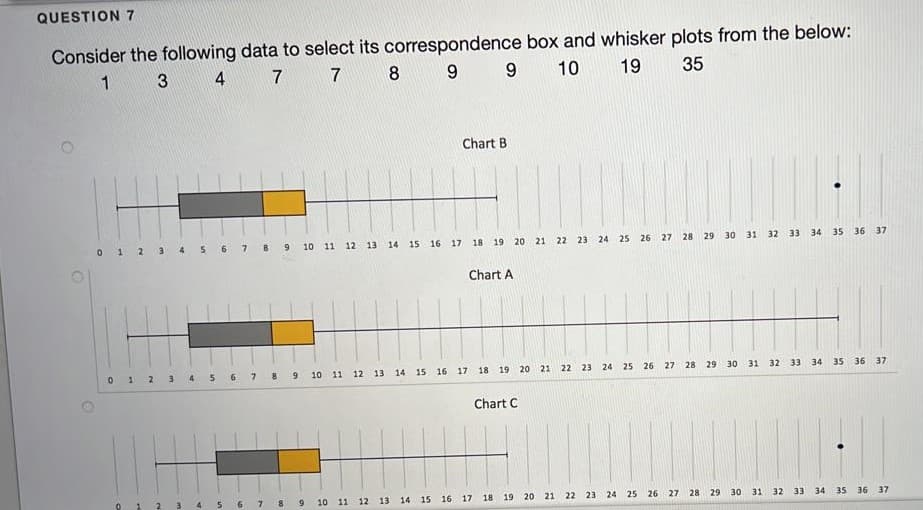
Transcribed Image Text:QUESTION 7
Consider the following data to select its correspondence box and whisker plots from the below:
1 3
4
7 7
9.
9
10
19
35
Chart B
01 2 3
4 5 6 7 8 9
10 11 12 13 14 15 16
17 18
19 20 21 22 23 24 25 26 27 28
29 30 31 32 33 34 35 36 37
Chart A
4
5 6 7 8
10 11 12 13
14 15 16 17
18 19 20 21
22 23
24 25 26 27 28 29
30 31 32 33 34 35 36 37
Chart C
10 11 12 13 14 15 16 17 18
19 20 21 22 23 24 25 26 27 28 29 30 31 32 33 34 35 36 37
Expert Solution
This question has been solved!
Explore an expertly crafted, step-by-step solution for a thorough understanding of key concepts.

Step by step
Solved in 2 steps

Recommended textbooks for you
Functions and Change: A Modeling Approach to Coll…
Algebra
ISBN:
9781337111348
Author:
Bruce Crauder, Benny Evans, Alan Noell
Publisher:
Cengage Learning
Functions and Change: A Modeling Approach to Coll…
Algebra
ISBN:
9781337111348
Author:
Bruce Crauder, Benny Evans, Alan Noell
Publisher:
Cengage Learning