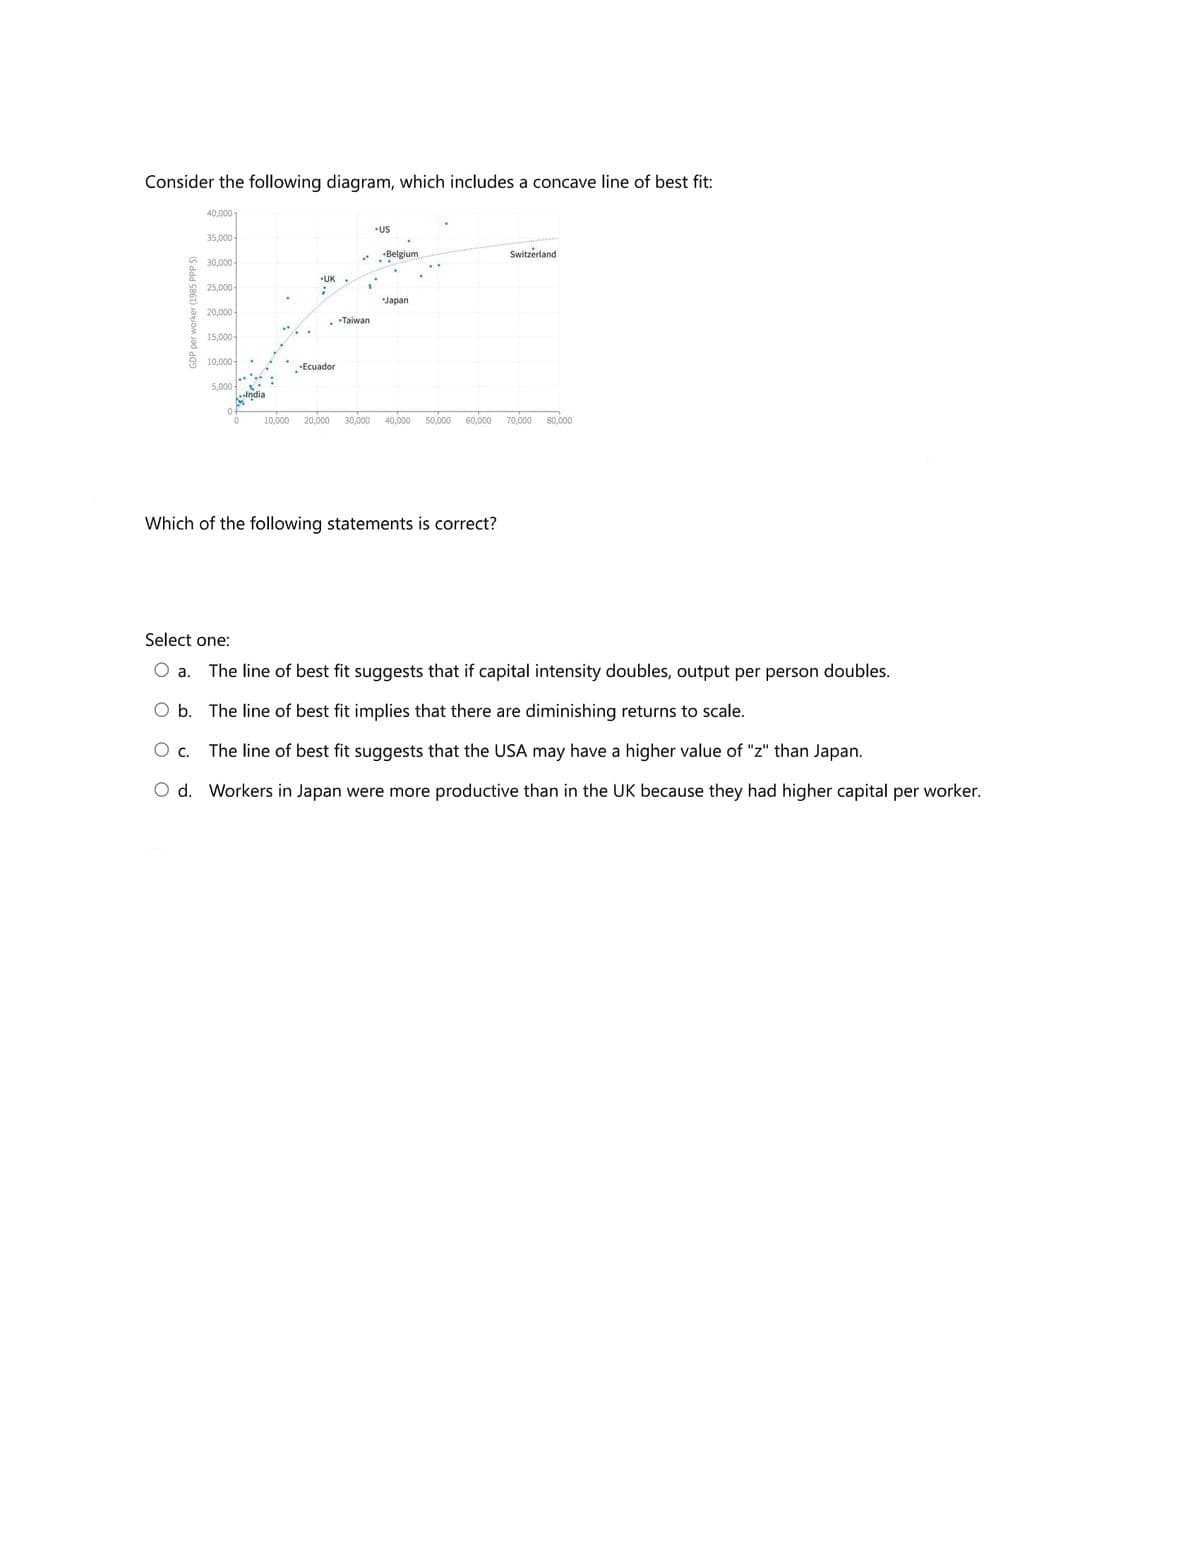
Consider the following diagram, which includes a concave line of best fit: 40,000 US 35,000 -Belgium Switzerland * 30,000 UK. 25,000- Japan 20,000 . Taiwan 15,000 E 10,000 Ecuador 5,000 10,000 20.000 30,000 40,000 50,000 60,000 70,000 80,000 Which of the following statements is correct? Select one: a. The line of best fit suggests that if capital intensity doubles, output per person doubles. O b. The line of best fit implies that there are diminishing returns to scale. O c. The line of best fit suggests that the USA may have a higher value of "z" than Japan. O d. Workers in Japan were more productive than in the UK because they had higher capital per worker.
Consider the following diagram, which includes a concave line of best fit: 40,000 US 35,000 -Belgium Switzerland * 30,000 UK. 25,000- Japan 20,000 . Taiwan 15,000 E 10,000 Ecuador 5,000 10,000 20.000 30,000 40,000 50,000 60,000 70,000 80,000 Which of the following statements is correct? Select one: a. The line of best fit suggests that if capital intensity doubles, output per person doubles. O b. The line of best fit implies that there are diminishing returns to scale. O c. The line of best fit suggests that the USA may have a higher value of "z" than Japan. O d. Workers in Japan were more productive than in the UK because they had higher capital per worker.

Chapter9: Sequences, Probability And Counting Theory
Section9.5: Counting Principles
Problem 5SE: Answer the following questions. 5. What is the term for the arrangement that selects r objects from...

Related questions
Question
Transcribed Image Text:Consider the following diagram, which includes a concave line of best fit:
40,000-
•US
35,000-
•Belgium
Switzerland
30,000-
•UK
25,000-
Japan
20,000
•Taiwan
15,000 -
10,000-
•Ecuador
5,000 -
slndia
10,000
20,000
30,000
40,000
50,000
60,000
70,000
80,000
Which of the following statements is correct?
Select one:
O a.
The line of best fit suggests that if capital intensity doubles, output per person doubles.
O b. The line of best fit implies that there are diminishing returns to scale.
O c.
The line of best fit suggests that the USA may have a higher value of "z" than Japan.
O d. Workers in Japan were more productive than in the UK because they had higher capital per worker.
GDP per worker (1985 PPP S)
Expert Solution
This question has been solved!
Explore an expertly crafted, step-by-step solution for a thorough understanding of key concepts.

Step by step
Solved in 2 steps

Recommended textbooks for you