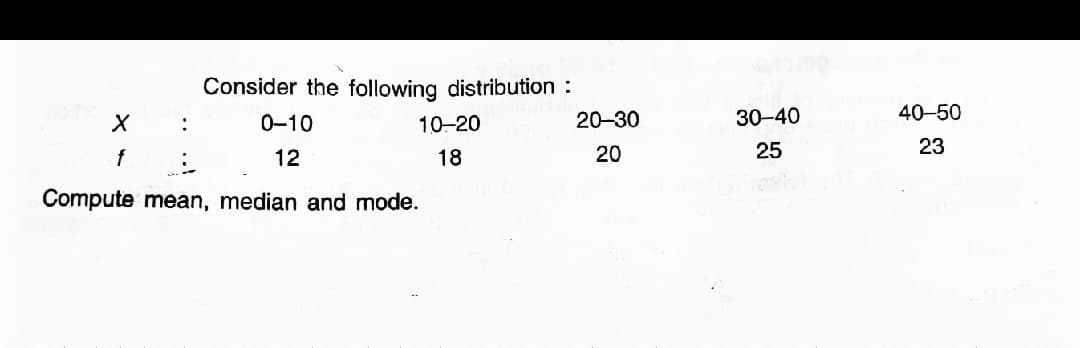
Consider the following distribution : 0-10 10-20 20-30 30-40 40-50 : f 12 18 20 25 23 Compute mean, median and mode.
Q: Compute the mean, precise median, and mode for the set of scores shown in the following frequency…
A: For the given frequency distribution table: Calculation of mean: Formula: X¯=∑ifixi∑ifi X f f * x…
Q: Calculate the median of the following distribution: CLASS FREQUENCY 10- 19 8 20-29 16 30-39 12 40-49…
A:
Q: The file contains the amount that a sample of nine customers spent for lunch ($) at a fast-food…
A:
Q: ?In a symmetrical distribution, what will be the relationship among the mean, median and mode Mean =…
A:
Q: 4. The following are the number of hours travelled by a senior high school student to go to school…
A: Given that XX X^2X2 .5 0.25 .25 0.0625 1.4 1.96 1.5 2.25 .85 0.7225 .20 0.04 1.5…
Q: Here are the snowfall amounts for 12 more-than-a-trace snowfalls for 2021 (rounded to the nearest…
A: Mean: Mean=sum of the data valuesNumber of data values =4+0+6+6+0+6+0+9+2+3+1+212…
Q: Given the following frequency distribution of number of vacationers per age bracket of vacationers…
A: Given: cumulative frequency (cf): Add previous frequencies to corresponding frequency . Class:…
Q: Consider the following types of data that were obtained from a random sample of 49 credit card…
A: (a) An outstanding balance on a credit card account is simply the total amount you owe at a given…
Q: CLASS 6-10 11-15 16-20 21-25 26-30 TOTAL FREQUENCY 7 18 20 17 8 70
A: Given Total frequency 70
Q: The following data provide the time in months from hire to promotion to manager f 25 software…
A:
Q: Use the following table to answer questions 1- 8. The numbers represent the points scored in 12…
A:
Q: The following data represent the difference in scores between the winning and losing teams in a…
A: Mean is given, by, Mean = (summation fiXi)/(summation fi) Where Xi's are midpoints. Median is given…
Q: The following are the number of patients who visited a walk-in clinic on each of 20 randomly…
A: From the given data we want to find mean, median and mode.
Q: If a distribution is negatively skewed, then Select one: a. mean median > mode d. median > mean >…
A: Result: if a distribution is negative skewed then Mean<Median<Mode
Q: Listed below are the scores of a certain basketball player in the 20 games he played during the…
A: The provided observation are in ascending order is,…
Q: Consider the following distribution of scores: 2,5,3,7,6,5. What is the mean?
A:
Q: hoose the letter of the correct answer. 20. Which of the following data show most likely the…
A: Hi! Thank you for the question, As per the honor code, we are allowed to answer one question at a…
Q: 2. The following is the distribution of the percentage of students belonging to a certain minority…
A: A measure of central tendency is a single value that attempts to describe a set of data by…
Q: An airline company gives out small bags of cookies to its travellers, and each bag does not always…
A: Given data; Cookies Frequency 22 2 17 12 14 3 15 6 16 11 20 2 19 5 21 4
Q: 6. The following data give the number of new cars sold at a dealership during a 12-day period 13, 5,…
A: see
Q: Given a positively skewed distribution with a median of 10 and a mode of 8. Which of the following…
A: Identify the correct option for the given statement. The correct option for the given statement is…
Q: The ungrouped data below shows the different temperatures measured during an experiment. Construct a…
A: Given information: N=30…
Q: The following are historical data on staff salaries (dollars per pupil) for 30 schools sampled in…
A:
Q: 2. Calculate the mean and median from the following data: Marks No of Students 0-10 10-20 10 20-30…
A:
Q: Calculate the median of a distribution with the following histogram:
A:
Q: 4. Consider the following frequency distribution below: Classes 11-21 22-32 19 33-43 31 44-54 39…
A:
Q: Calculate the median of a distribution with the following histogram: 9. 11.5 20.5 29.5 38.5 Class…
A: Median is the value which divides the data into two equal parts. The frequency of a class in grouped…
Q: The following set of data is from a sample of n = 7: 12 7 4 9 0 7 3 answer the following questions…
A:
Q: Find out the mean, median and mode of the following distribution : Marks Frequency Marks Frequency…
A:
Q: Consider the following frequency distribution. Class Midpoint Frequency 0 – 9 4.5 6 10 – 19 14.5 14…
A:
Q: Calculate the median of the following distribution: CLASS FREQUENCY 10-14 4 15-19 12 20-24 16 25- 29…
A:
Q: At a single high-end restaurant in England over a 3-week period, there were 141 tables of diners.…
A: Disclaimer : Since you have posted a question with multiple sub-parts, we will solve first three…
Q: 4. Given the following distribution: Scores Frequency 145 - 154 7 135 - 144 13 125- 134 28 115 - 124…
A: Given:
Q: The following data show the number of hours spent watching television for 10 randomly selected…
A: Range: For a set of observations, range is defined as the difference between the maximum and the…
Q: Use the following frequency distribution table to find the value of the mean score. Scores Frequency…
A: Given frequency distribution table; Scores Frequency(n) mid-point(x) n.x 1-5 3 3 9 6-10 6 8…
Q: Consider the distribution below. Compute for the mean and variance. 10 20 30 40 50 P(x) 5% 5% 25%…
A: Given data is x 0 10 20 30 40 50 P(x) 5% 5% 25% 20% 30% 15%
Q: For the following distribution, what is the highest score? 20-25 15-19 10-14 5-9 2 5 4 1 a) 22 b) 25…
A: Solution: 8. The given data is
Q: 2. The following data set belongs to a sample: 14 18 -1 0 8 8 -16 Calculate the mean, median, and…
A: 2. Step-by-step procedure to obtain the mean, median and mode using Excel is given below: In Excel…
Q: Compute for the mean and variance of the given frequency distribution below: Score Number of…
A: Frequency (f) f⋅x f⋅x2 5 3 15 75 8 5 40 320 10 4 40 400 12 5 60 720 15 3 45 675 ---…
Q: Suppose that a hospital tested the age and body fat data for 18 randomly selected adults with the…
A: Use EXCEL Procedure to obtain the values of mean, median and Standard deviation for the variable…
Q: . The ungrouped data below shows the different temperatures measured during n experiment. Construct…
A: The objective is to construct a frequency table for the ungrouped data and calculate its mean,…
Q: 10 8 6 14 22 13 17 19 5 16 11 9 18 14 13 12 15 15 11 11
A:
Q: If a distribution is positively skewed, then Select one: a. mean median > mode c. median > mean >…
A: Basics:
Q: 2. The following is the distribution of the percentage of students belonging to a certain minority…
A: We have given that The percentage of students belonging to a certain minority group in 40 school…
Q: The following data set shows the frequencies of the grouped scores for the 2008 Masters Golf…
A:
Q: To determine if there is evidence that the mean amount of money spent on food each month differs for…
A: Given that, Mean amount of money spent on food each month differs for students who lived on and off…
Q: For the given data set 3 4 6 7 4 3 8 11 20 23 25 1 2 4 11 22 19 17 15 10 14 12…
A:
Q: Which of the following gives the correct order of the measure of central tendency from highest to…
A: As per our guidelines we can solve first MCQ and rest can be reposted. Q .47 Solution-: We find the…
Q: The following data represent the age distribution of a sample of 70 women having multiple-delivery…
A: Given, The age frequency distribution, Lower limit Upper Limit Midpoint(x) Number(F) Cumulative…
Trending now
This is a popular solution!
Step by step
Solved in 4 steps with 3 images