Consider the following frequency table representing the distribution of hours students study for an exam in a week. Determine the class width of each class. Hours Students Study for an Exam in a Week Class 20-28 29-37 38-46 47-55 56-64 Frequency 14 2 12 3 11
Consider the following frequency table representing the distribution of hours students study for an exam in a week. Determine the class width of each class. Hours Students Study for an Exam in a Week Class 20-28 29-37 38-46 47-55 56-64 Frequency 14 2 12 3 11

Glencoe Algebra 1, Student Edition, 9780079039897, 0079039898, 2018
18th Edition
ISBN:9780079039897
Author:Carter
Publisher:Carter
Chapter10: Statistics
Section10.6: Summarizing Categorical Data
Problem 4DGP

Related questions
Question
100%
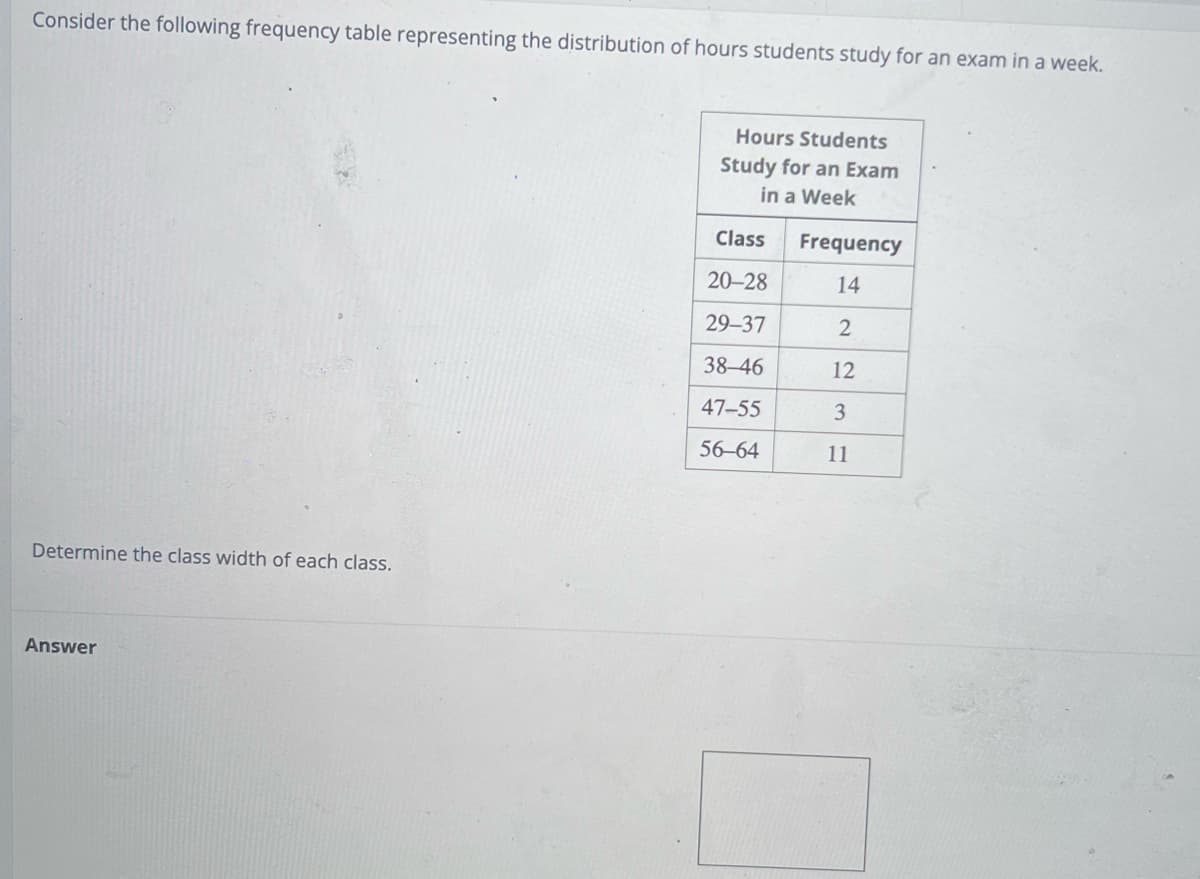
Transcribed Image Text:Consider the following frequency table representing the distribution of hours students study for an exam in a week.
Determine the class width of each class.
Answer
Hours Students
Study for an Exam
in a Week
Class
20-28
29-37
38-46
47-55
56-64
Frequency
14
2
12
3
11
Expert Solution
This question has been solved!
Explore an expertly crafted, step-by-step solution for a thorough understanding of key concepts.

This is a popular solution!

Trending now
This is a popular solution!

Step by step
Solved in 3 steps with 1 images

Recommended textbooks for you
Glencoe Algebra 1, Student Edition, 9780079039897…
Algebra
ISBN:
9780079039897
Author:
Carter
Publisher:
McGraw Hill
Glencoe Algebra 1, Student Edition, 9780079039897…
Algebra
ISBN:
9780079039897
Author:
Carter
Publisher:
McGraw Hill