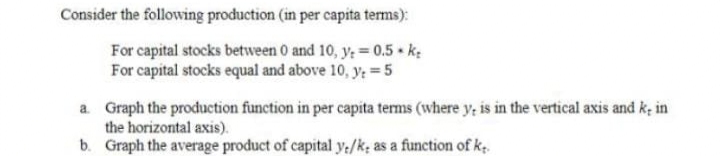
Consider the following production (in per capita terms): For capital stocks between 0 and 10, y; 0.5 k. For capital stocks equal and above 10, y; 5 a. Graph the production function in per capita terms (where y, is in the vertical axis and k, in the horizontal axis). b. Graph the average product of capital y./k, as a function of k.


Q: According to the graph: Select one or more: a. UK workers have more free time than Greek workers.…
A: According to the graph, the x axis measures the average annual hours of free time per worker and y…
Q: Output per worker is given by yt = A¢k% with a = 1/3. In the year 1900 this country had a…
A: Production Function : y(t) = Atkta where , a = 1/3 y(t) = Output / Labor kt= Capital/labor let…
Q: Using the production function Real GDP = T (L, K), define the term production function and describe…
A: Production Function Production function can be defined as an economic equation which shows…
Q: The following graph shows a variety of possible production functions (PFs) in an imaginary economy,…
A: It has been assumed that human capital and technology is at constant levels.
Q: When the capital stock per hour worked: Select one: a. increases, labour productivity in increases.…
A: Labor productivity is determined by the level of capital and the level of human capital. Increasing…
Q: 1. Assume that a country's production function is Y = KILĀ. Assume there is no population growth or…
A: It is given that Y=K1/2L1/2
Q: The outputs per laborer per day in the production of computers and autos in Nation 1 and in Nation 2…
A: c. Nation 2 had comparative advantage in the production of computers. So, only national 2 can…
Q: A “miraculous" Asian economy has an aggregate wage bill of 300 billion dollars and an aggregate GDP…
A: Aggregate Production Function : Y = AKaL1-a Proportionate Change in Labor or dL/L = 0.06…
Q: Country A and country B both have the production function Y = F(K, L) = K^0,5L^0,5 A. Does this…
A: This given production function does not have constant return to scale. This function exhibits…
Q: On January 1, 2026, each of Boblandia's 100 workers has $2 in physical capital. Over the course of…
A:
Q: Consider a closed economy with the following production function. Y=K0.SN0.5. Let the evolution of…
A: Ghd
Q: A country's production is described by the function f(x, y) = 30x y units, when x units of labor and…
A: Answer: Given, (a). (b). At x=100 and y=30 the marginal productivity of labor will be as given…
Q: Imagine that if you decide to build a factory for real investment in Home or in For- eign country.…
A: The equilibrium situation is given by the equality of return on capital goods in both the home…
Q: Consider an economy with a Cobb-Douglass production function Y = A1-«KªN1-a Where TFP, A, grows at a…
A:
Q: Classify each of the following as a movement along or a shift of the production function and provide…
A: Total Revenue: The revenue of the firm refers to the total amount of money that is being collected…
Q: Suppose that K(t+5)/N > K(t+3)/N, where K(t+3) is capital in period t+3 and K(t+5) is capital in…
A: Here, it is given that capital per worker in t+3 period is less than capital per worker in t+5…
Q: Suppose the total production is 1200 bushels of corn and 1000 tons of steel. Then, • the US is…
A: Opportunity cost is the cost incurred when one good has to be given up for the production of another…
Q: Based on two period model: population growth results in a decrease in the relative amount allocated…
A: Because when consumption increases, marginal cost is greater than average cost. When consumption is…
Q: Write the production function (human capital (H) is included in TFP) and the logarithmic form of…
A: Total production function shows the how each inputs determine the total output For example,…
Q: Classify each of the following as a movement along or a shift of the production function and provide…
A: Since you have posted a question with multiple subparts we will solve first three parts for you and…
Q: Which of the following might increase the economy's ability to product output over the long run,…
A: LRAS is long run aggregate supply which is vertical at full employment.
Q: A country has a Cobb-Douglas production function given by: Y = AK0.10.3 If total factor productivity…
A: Total factor productivity (TFP) is a measure of productivity
Q: The production function for an economy is Y; = 1.5 K;ª L¢(1«), where Y; is total output, Ke is total…
A: (A) Yt= 1.5 kα L1-αYt= 1.5 kα ⇒St= 0.2Yt (B) Fundamental equation of solow swan model is Sy = (n+d)k…
Q: Which of the following statements about labour productivity (Y/L), also known as the average product…
A: Labour Productivity Labour productivity is defined as actual production per labor hour, and the…
Q: Labor productivity can best be defined as the ratio of workers in the economy to the population. the…
A: Answer (1); option d (the ratio of the output of goods and services to the labor hours devoted to…
Q: In Wonderland production per worker (y) depends on capital per worker (3) such the y=10√k. Every…
A: Output per worker : y = 10(k)0.5 Depreciation (d)= 15% Saving rate(s) = 10% Population growth rate…
Q: Consider the following production (in per capita terms): For capital stocks between 0 and 10, y, =…
A: Harrod-Domar model: The Harrod-Domar model is used to describe an economy's growth rate in terms of…
Q: Consider the following (made-up) statistics for some econ-omies. Assume the exponent on capital is…
A: Growth accounting is a process by which the contribution of different factor inputs into economic…
Q: Provide the complete sketch of Homogeneous production function, supporting your answer…
A: In microeconomics, a firm’s production function represents the technology that shows how much output…
Q: b. Compute the multifactor productivity figures for labor and capital together. (Round your answers…
A: Given the information: Sales unit of U.S. = 90000 Labour hours of U.S. = 20105 Raw material…
Q: In the production function, Total factor productivity = A = 3.5% Labor input = L = 0.75 Capital…
A: Your question is a classic case of CES production function. The total factor productivity in the…
Q: Which one is true? labor productivity will be higher when the capital stock is larger and the rate…
A: Labor productivity represents the total amount of production (measured in terms of Gross Domestic…
Q: Assume the production function takes the general form: Y=Z*F (K,L,A) where all marginal products…
A: The production function is defined as follows: Y = Z × F (K, L, A) where, Y = output z = technology…
Q: In Wonderland production per worker (y) depends on capital per worker (3) such the y=10√k. Every…
A: The question is related to the Solow model of economic growth.
Q: Let us consider the following Cobb-Douglas production function P, A, LPK2e", Where P = level of…
A: Cobb-Douglas production function gives a functional relationship between input and output. It is…
Q: Question 4 Classify each of the following as a movement along or a shift of the production function…
A: Hi Student, Thanks for posting the question. As per the guideline, we are providing answer for the…
Q: Labour-saving technical progress means O that marginal productivity of capital increases. that…
A: Technical progress either be labor-saving or capital saving. Technical progress is capital saving is…
Q: Which of the following changes would increase labor productivity? Group of answer choices Workers in…
A: Labor productivity is the amount of goods and services that a group of workers produce in a given…
Q: As an alternative to the story of Robinson Crusoe, macroeconomists use the "aggregate production…
A: “Since you have posted a question with multiple sub-parts, we will solve first three subparts for…
Q: An increase in labor productivity means businesses will produce more output with the same amount of…
A: Labor productivity refers to the amount of goods and services produced by the workforce at a given…
Q: In the Cobb-Douglas production function, Y = KªL'-a, if a = 1/4, then labor's share of GDP is half.…
A:
Q: Classify each of the following as a movement along or a shift of the production function and provide…
A: Hello. Since your question has multiple sub-parts, we will solve the first three sub-parts for you.…
Q: Classify each of the following as a movement along or a shift of the production function and provide…
A: To explain about the movement and shift in the production function, it is necessary to understand…
Q: Classify each of the following as a movement along or a shift of the production function and provide…
A: Each of the given movements has an impact on shifting production possibilities frontier.
Q: The following graph shows a variety of possible production functions (PFs) in an imaginary economy,…
A: It is given that technology and human capital is at constant level.
Q: In 2000 GDP per capita was 14.2, capital/output was 3.5, human capital
A: ANSWER STEP-1 SOLUTION:- According to the given data we have cobb- Douglas production function is in…

Step by step
Solved in 2 steps with 2 images


- Country A and country B both have the production function Y = F(K, L) = K^0,5L^0,5 A. Does this production function have constant returns to scale? Explain. B. What is the per-worker production function, y = f(k)? C. Assume that neither country experiences population growth or technological progress and that 5 percent of capital depreciates each year. Assume further that country A saves 10 percent of output each year and country B saves 20 percent of output each year. Using your answer from part (b) and the steady-state condition that investment equals depreciation, find the steady-state level of capital per worker for each country. Theen find the steady-state levels of income per worker and consumption per worker. D. Suppose that both countries start off with a capital stock per worker of 2. What are the levels of income per worker and consumption per worker? Remembering that the change in the capital stock is investment less depreciation, use a calculator or a computer spreadsheet…Suppose the 50% of the income generated by an economy is paid to workers, thus implying that the remaining 50% is paid to capital. If GDP grew by 4%, capital grew by 1%, and labor grew by 3%, then what was the growth rate in technology? (Record your answer as a whole number, and do not include a "%".)Ma1. two countries have the same effectiveness of labor production function Y = F (K,LE) = K^0.5 (LE)^0.5 a. what is the per effective worker production function for these countries? b . what is the steady state value of y as a function of s, n, g, and δ only? c. countries A and b are identical in every way except rate of savings. countries A has a savings rate of 17 percent and country B has a savings rate of 10 percent. for both countries the rate of technical progress is g = 0.04 the birth rate is n = 0.05 and depreciation δ = 0.04. find the steady state value of y for each country. compare and comment
- The following graph shows a variety of possible production functions (PFs) in an imaginary economy, assuming constant levels of human capital and technology. Because human capital and technology remain unchanged, each of these production functions represents a different level of the capital stock. Fill in the table with the curve that corresponds to each of the capital stock levels described. Levels of Capital Stock This corresponds to which curve? (PF1, PF2, PF3) Highest Middle Lowest Fill in the blank: The slope of the line connecting the origin to point B is __________ (options: flatter, steeper) than the slope of the line connecting the origin to point A, because the slope of such a line is equivalent to ___________ (options: productivity, the marginal physical product of labor, marginal cost).Please no written by hand and graph Consider a small world that consists of two different countries, a developed and a developing country. In both countries, assume that the production function takes the following form: Y = F (K, LE) = K¹/4 (LE) 3/4, where Y is output, K is capital stock, L is total employment and E is labour augmenting technology. (a) Does this production function exhibit constant returns to scale in K and L? Explain. (b) Express the above production function in its intensive form (i.e., output per-effective worker y as a function of capital per effective worker k). (c) Solve for the steady-state value of y as a function of saving rate s, population growth rate n, technological progress g, and capital depreciation rate 6. (d) The developed country has a savings rate of 30% and a population growth rate of 2% per year. Meanwhile, the developing country has a savings rate of 15% and population growth rate of 5% a year. Technology evolves at the rate of 8% and 2% in…Assume that Economyland’s production function is Y = F (K, L) = K 0.5 L 0.5Where Y is output level, K is the amount of capital input, and L is the amount of laborinput. a) What is the per-worker production function, y= f (k) for Economyland? b) Assume that 10 percent of capital depreciates each year and savings rate is 20 percent,find the steady-state level of capital per worker for Economyland. Then find the steady-state levelof income per worker and steady-state level of consumption per worker. c) Is it possible to save too much? Why?
- Write the production function (human capital (H) is included in TFP) and the logarithmic form of this production function then explain why the GDP growth will be at the end ofa given long period lower than at the beginning of this period, assuming that the average contribution of TFP to GDP average growth during the period is constant.Suppose a country has a population of 120 people, a working-age population of 100 people, its labor force participation rate is 0.5 (50%), and the quantity of output is 60 units. Suppose that the production function of the economy is given by Y=2N, where Y represents the quantity of output and N represents the number of workers needed to produce the output. I know the answer is 0.4 but I don't understand how to get it. Thank you!The aggregate production function is y=3KL. If they are 30 units of capital and 40 units of labor, what is aggregate output? What is labor productivity? What is capital productivity?
- Consider the economies of Hermes and Gribinez, both of which produce gaggles of gop using only tools and workers. Suppose that, during the course of 10 years, the level of physical capital per worker rises by 5 tools per worker in each economy, but the size of each labor force remains the same. Complete the following tables by entering productivity (in terms of output per worker) for each economy in 2016 and 2026. **THE TABLE IS ATTACHED** Initially, the number of tools per worker was higher in Hermes than in Gribinez. From 2016 to 2026, capital per worker rises by 5 units in each country. The 5-unit change in capital per worker causes productivity in Hermes to rise by a _________ (LARGER/SMALLER) amount than productivity in Gribinez. This illustrates the _______ (CATCH-UP/NATURAL RESOURCES/TECHNOLOGY/HUMAN CAPITAL) effect. THANK YOU FOR THE HELPA CES production function with physical and human capital Consider the CES production function in terms of physical capital, K, and human capital, H: where 0 a. Set up the Hamiltonian and find the first-order conditions. b. What is the optimal relation between K and H? Substitute this relation into the given production function to get a relation between Y and K. What does this “reduced-form” production function look like? c. What is the steady-state value of the ratio of physical to human capital, (K/H)∗? d. Describe the behavior of the economy over time if the initial condition is such that K(0)/H(0)? e. Suppose that the inequality restrictions IK ≥ 0 and IH ≥ 0 apply. How do these constraints affect the dynamics if the economy begins with K(0)/H(0)∗?Labour-saving technical progress meansa) that marginal productivity of capital increases.b) that marginal productivity of labour increases.c) that marginal productivity of both inputs increases.d) None of the above is correct.
