Consider the following regression model: Weekly Hours = Bo + B1 × Wage¡ + u¿ Weekly Hours is the average number of hours the individual worked over the course of the year and Wage is the individual's average hourly wage over the course of the year. A researcher who collects data and regresses Weekly Hours against Wage finds that B1 > 0. The OLS estimator, ß1, however, likely suffers from omitted variable bias because those individuals who earn high wages may be driven personalities who would work long hours no matter the wage. Because of this omitted variable bias, it is likely the case that B1_B1.
Consider the following regression model: Weekly Hours = Bo + B1 × Wage¡ + u¿ Weekly Hours is the average number of hours the individual worked over the course of the year and Wage is the individual's average hourly wage over the course of the year. A researcher who collects data and regresses Weekly Hours against Wage finds that B1 > 0. The OLS estimator, ß1, however, likely suffers from omitted variable bias because those individuals who earn high wages may be driven personalities who would work long hours no matter the wage. Because of this omitted variable bias, it is likely the case that B1_B1.

College Algebra
7th Edition
ISBN:9781305115545
Author:James Stewart, Lothar Redlin, Saleem Watson
Publisher:James Stewart, Lothar Redlin, Saleem Watson
Chapter1: Equations And Graphs
Section: Chapter Questions
Problem 10T: Olympic Pole Vault The graph in Figure 7 indicates that in recent years the winning Olympic men’s...

Related questions
Question
Question 4
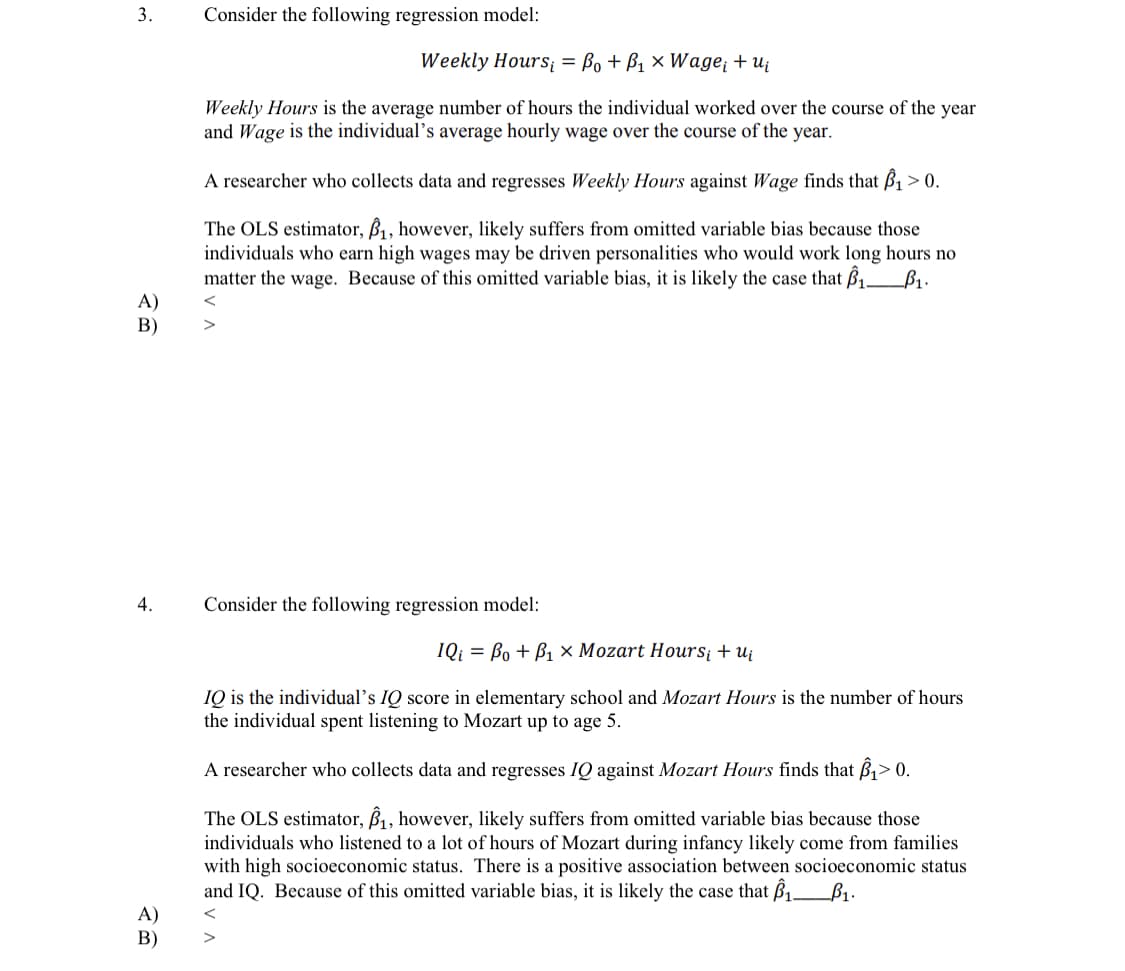
Transcribed Image Text:3.
Consider the following regression model:
Weekly Hours = Bo + B1 × Wage¡ + uj
Weekly Hours is the average number of hours the individual worked over the course of the year
and Wage is the individual's average hourly wage over the course of the year.
A researcher who collects data and regresses Weekly Hours against Wage finds that ß1 > 0.
The OLS estimator, B, however, likely suffers from omitted variable bias because those
individuals who earn high wages may be driven personalities who would work long hours no
matter the wage. Because of this omitted variable bias, it is likely the case that B1_B1.
A)
В)
4.
Consider the following regression model:
IQi = Bo + B1 × Mozart Hours¡ + ui
IQ is the individual's IQ score in elementary school and Mozart Hours is the number of hours
the individual spent listening to Mozart up to age 5.
A researcher who collects data and regresses IQ against Mozart Hours finds that B1> 0.
The OLS estimator, B1, however, likely suffers from omitted variable bias because those
individuals who listened to a lot of hours of Mozart during infancy likely come from families
with high socioeconomic status. There is a positive association between socioeconomic status
and IQ. Because of this omitted variable bias, it is likely the case that ß1_B1.
A)
В)
Expert Solution
Step 1
Given information:
The regression model is given.

Trending now
This is a popular solution!

Step by step
Solved in 2 steps

Recommended textbooks for you
College Algebra
Algebra
ISBN:
9781305115545
Author:
James Stewart, Lothar Redlin, Saleem Watson
Publisher:
Cengage Learning

Linear Algebra: A Modern Introduction
Algebra
ISBN:
9781285463247
Author:
David Poole
Publisher:
Cengage Learning
College Algebra
Algebra
ISBN:
9781305115545
Author:
James Stewart, Lothar Redlin, Saleem Watson
Publisher:
Cengage Learning
Linear Algebra: A Modern Introduction
Algebra
ISBN:
9781285463247
Author:
David Poole
Publisher:
Cengage Learning