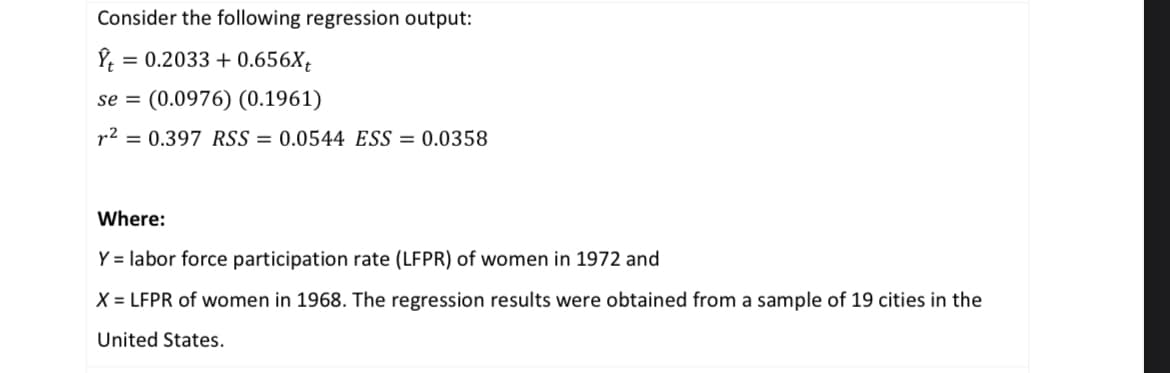
Consider the following regression output: Ît = 0.2033 +0.656Xt se (0.0976) (0.1961) r² = 0.397 RSS=0.0544 ESS = 0.0358 Where: Y = labor force participation rate (LFPR) of women in 1972 and X = LFPR of women in 1968. The regression results were obtained from a sample of 19 cities in the United States.


Q: What is the difference between an observational study and an experiment? Choose the correct answer…
A: In the observational study the effect of a specified variable (through the sample observations) is…
Q: State whether you think the difference between what occurred and what you would expect by chance is…
A: Statistical significance Statistical significance is the statement that the results of a collection…
Q: Aaliyah is 74 years old. Based on a normal distribution with mean 47.8 years and standard deviation…
A: Formula : Z =(X - μ)/σ
Q: You are in graduate school and are now doing research on housing affordability in Oregon for your…
A: Given data: Baby boom Gen X Millenial Gen Z Total House (Owner) 53 49 40 30 172 House…
Q: courseld=17388460&OpenVellumHMAC=91a79942 Part5 A study finds that the carapace length of an adult…
A: The mean is 14.27 and the standard deviation is 1.25.
Q: Which class has the greatest frequency? The class with the greatest frequency is from to Which class…
A: here use given data and create grouped frequency table here no of class = 5
Q: Choose one energy source at random. Find the probabilities of the following. Enter your answers as…
A: Solution-: Given: Oil (41%), Natural Gas (20%), Coal (24%), Nuclear (9%), Hydropower (3%) and Other…
Q: Test the claim that the mean GPA of night students is smaller than 2.8 at the .05 significance…
A:
Q: The table below shows the probability distribution of the random variable X. a. Find the mean of the…
A: Solution Given: x P(X=x) 1 0.2 2 0.1 3 0.7
Q: Time (Months) Number of Articles 0-0.9 46 1.0-1.9 18 2.0-2.9 15 3.0-3.9 20 4.0-4.9 14 5.0-5.9 13…
A: Given A few articles took longer than 6 months to review; these are omitted from the table. Consider…
Q: Managers at an automobile manufacturing plant would like to estimate the mean completion time of an…
A: Formula :
Q: 2. When you get ready to get dressed for school you open your closet to find that you haw the…
A: 2) The number of color shirts is 3.
Q: The lengths and weights of a zoo's pygmy shrews were recorded during their annual health check.…
A: The regression equation is given by y = a + bX
Q: Determine U-x and ox from the given parameters of the population and sample size.. A = 81 0=18 n =…
A: Formula : σₓ̄ = σ/√n
Q: General Direction: Perform each of the following steps. . Find the Spearman rank correlation…
A: Given information: no. of schools=5no. of variables=2Variables=1. No. of students2. Per-pupil cost
Q: If the order of matrix A is map and the order or B Is pen, then ?AB is
A:
Q: the probability that maximum speed is at most 49 km/h? (Round your answer to four decimal places.)…
A: Given Mean=46.7 Standard deviation=1.75
Q: The random variable X is the crew size of a ra 2 4 5 P(X-X) 0.025 0.045 0.306 C a. Find and…
A:
Q: (F). (Round to three decimal places as Evaluate the formula E=z, # where z = 1.960, o= 32.43, and n…
A:
Q: what are the null and alternative hypotheses? B) determine the test statistic __( round to two…
A:
Q: Which of the following statements about point estimates is NOT TRUE? A. The best point estimate of…
A: The objective is to find the statements which are not true.
Q: important that the variance of the percentage impurity levels in consignments of a chemical not…
A: Given that Sample size n =20 Sample variance =5.62 Population variance =4
Q: In a group of 103 students, 34 are diploma level and 22 are bachelor level. Find the probability…
A:
Q: Create a histogram, and calculate x¯, the t-statistic, and the p-value. 11018.0428203882…
A: Given, A company that makes LED light bulbs claims that the bulbs have a lifetime of 11,000 hours.…
Q: Identify the null hypothesis, alternative hypothesis, test statistic, P-value, conclusion about the…
A: The following information has been given: One Way Anova Table: Source DF SS MS F P Size 3…
Q: The stock of a warehouse consists of boxes of high, medium and low quality lightbulbs in respective…
A:
Q: The following data represent the speed at which a ball was hit (in miles per hour) and the distance…
A: Given that Using excel regression
Q: The height of the dogs in a pet shop is normally distributed with the average height of 25 cm and…
A:
Q: The average score for games played in the NFL is 22 and the standard deviation is 9.3 points. 18…
A: If X~N(μ , σ ) Then , x¯ ~Nμ, σn an ∑x ~N(nμ , σn )
Q: how to eliminate biasness in a study
A: Biasness is an error that occurs in statistical analysis.
Q: girl draws 6 ribbons at random from a bag containing 5 violet ribbons and 4 yellow ribbons. What is…
A: Given :A girl draws 6 ribbons at random from a bag containing 5 violet ribbons and 4 yellow ribbons.…
Q: You may need to use the appropriate appendix table or technology to answer this question. A survey…
A:
Q: Identify the sampling techniques used, and discuss potential sources of bias (if any). Explain.…
A: Solution: Stratified random sampling: Stratified random sampling is a type of probability or random…
Q: The average amount of money that people spend at Don Mcalds fast food place is $7.9000 with a…
A:
Q: An ecologist wishes to mark off a circular sampling region having radius 9 m. However, the radius of…
A:
Q: Question 3 Part 1: Two fair dice are rolled (a) Calculate the probability that two sixes will…
A: The question is about probability Given : Two fair dice are rolled
Q: Write an example of a research study that would be most appropriate for a within subjects ANOVA
A: With-in subjects ANOVA: ANOVA in which subjects are tested under different conditions is known as…
Q: Theorem 1. The variate F with 1 and n degrees of freedom is distributed as t variate with n.d.f.
A:
Q: Let X = the number of nonzero digits in a randomly selected 4-digit PIN that has no restriction on…
A: The variable X denotes the number of nonzero digits in a randomly selected 4 digit PIN.
Q: school registrar estimates that the dropout rate of freshmen high schools in Valenzuela is 6. Last…
A: Given that Sample size n =500 Favorable cases x =90 Sample proportion p^=x/n =90/500 =0.18
Q: A bin contains 5 red and 5 green balls. 2 balls are chosen at random, without replacement. Let the…
A:
Q: A certain security system contains 12 parts. Suppose that the probability that each individual part…
A: Given that: A certain security system contains 12 parts. The probability that each individual part…
Q: An insurance company wants to know if the average speed at which men drive cars is higher than that…
A: Confounding variable has a strong influence in causal relationship.
Q: Business Statistics. Lothian café ordered the following tea from the supplier, calculate the…
A:
Q: A student takes a true-false test consisting of 6 questions. Assume that the student guesses at each…
A: Solution-: Given: n=6 A student takes a true-false test consisting of 6 questions. We want to find,…
Q: A fast food restaurant boasts that their mean wait time in the drive-thru line is less than 3…
A: Given Information: Number of customers n=125 Sample mean wait time x¯=2.82 Population standard…
Q: How would you interpret the following data?
A: Regression Analysis: The most extensively utilized analysis tool for exploring or measuring the…
Q: Please analyse the table 3 and 4 in the image attached. the data is supposed to see if there is a…
A: Given information: Table 3. Summary Table: Prevalence of obesity Continent t df p-value…
Q: A particular milk tea contains an average of 200mL per cup with a standard deviation of 10mL. A milk…
A: The following information has been given: The population mean is μ=200. The population standard…
Q: Question 1 Do students in fraternities and sororities do better or worse than other students…
A:

Step by step
Solved in 3 steps with 3 images

- Consider a linear regression model for the decrease in blood pressure (mmHg) over a four-week period with muy=2.8+0.8x and standard deviation chi=3.2. The explanatory variable x is the number of servings fruits and vegetables in a calorie-controlled diet. Using the 68-95-99.7 rule, between what two values would approximately 95% of the observed responses, y, fall when x = 7?Consider the multiple regression for the following experiment: yi=b0+b1x1i+b2x2i+b3x3i+ei Where yi is the number of touchdowns, x1i is rushing yards, x2i is passing yards, and x3i is the “time of possession of the football” in minutes for that football team. Which of the following statements is true when making an interpretation of the sample slope coefficient? a) a. b2 represents the marginal change in passing yards for every additional touchdown, holding the other variables constant b) b. b2 represents the marginal change in touchdowns for every additional passing yard, holding the other variables constant c) c. b1 represents the marginal change in touchdowns for every additional passing yard, holding the other variables constant d) d. b3 represents the marginal change in touchdowns for every additional minute of time of possession, holding touchdowns constantGiven the partial results from a linear regression model below, a sample size of 504, and ɑ=0.05, What is the F-Statistic for the overall model? Is it statistically significant? What is the R2 for the regression model above?
- Consider the following sample regression equation yˆ = 150 − 20x, where y is the demand for Product A (in 1,000s) and x is the price of the product (in $). The slope coefficient indicates that if _____An investigation into the relationship between an adolescent mother's age x in years and the birth weight y of her baby in grams yielded the regression equation y= - 1163.45 + 245.15x as well as r = .88369, r2= .78091, SSE = 337212.45, and s= 205.30844 1) What is the predicted birth weight for a baby brn to a 17 year old woman? 2) What is the propotion of the variability in the weights of babies born to adolescent mothers that is accounted for by the mother's age? 3) For every additional year in the mother's age that mean birth weight of the baby? (a) increases by about 245g (b) decreases by about 245g (c) increases by about 1163g (d) increases by about 1163g (e) changes by an amount that cannot be determined from the information given.Based on the results of the regression, what would be the mose likely conclusion?
- Jimmy tested a sample with of n=4 pairs of X and Y scores and found SSY = 48 and a Pearson correlation between X and Y of r = 0.4 Calculate whether the Fobserved in this regression experiment is significant at the ∞ = o.01 levelI see that you ran a correlation for Pearson's r, can you run a linear regression?In the following model, "employed" is a dummy indicating a person is employed: donation = B + B edu + Bemployed + uT Running this model will produce the same results of differential in donation between employed people and unemployed people as running two separate regressions for employed people and unemployed people. A. True B. False
- Consider a linear regression model for the decrease in blood pressure (mmHg) over a four-week period with muy=2.8+0.8x and standard deviation chi=3.2. The explanatory variable x is the number of servings fruits and vegetables in a calorie-controlled diet. The decrease in blood pressure y will vary about this subpopulation mean. What is the distribution of y for this subpopulation?which of the following regressions represents the strongest negative linear relationship between x and y? (Attached in picture provided)Suppose the following data were collected from a sample of 5 car manufacturers relating monthly car sales to the number of dealerships and the quarter of the year. Use statistical software to find the following regression equation: SALESi= b0 + b1DEALERSHIPSi + b2 QUARTER1i+ b3QUARTER2i + b4QUARTER3i+ ei Is there enough evidence to support the claim that on average, car sales are higher in the 4th quarter than in the 2nd quarter at the 0.01 level of significance? If yes, write the regression equation in the spaces provided, rounded to two decimal places. Else, select "There is not enough evidence." Monthly Sales Number of Dealerships 1st Quarter (1 if Jan.-Mar., 0 otherwise) 2nd Quarter (1 if Apr.-Jun., 0 otherwise) 3rd Quarter (1 if Jul.-Sep., 0 otherwise) 4th Quarter (1 if Oct.-Dec., 0 otherwise) 85482 4 1 0 0 0 101319 9 1 0 0 0 121389 12 1 0 0 0 133677 18 1 0 0 0 194588 22 1 0 0 0 82128 4 0 1 0 0 150407 9 0 1 0 0 242714 12 0…