Consider the following sample data. Sample A: Sample B: Sample C: 13, 23, 33 71, 81, 91 1,050; 1,060; 1,070 (a) Find the mean and standard deviation for each sample. Sample A Sample B Sample C Mean Sample Standard Deviation (b) What does this exercise show about the standard deviation? O The idea is to illustrate that the standard deviation is not a function of the value of the mean. O The idea is to illustrate that the standard deviation is a function of the value of the mean.
Consider the following sample data. Sample A: Sample B: Sample C: 13, 23, 33 71, 81, 91 1,050; 1,060; 1,070 (a) Find the mean and standard deviation for each sample. Sample A Sample B Sample C Mean Sample Standard Deviation (b) What does this exercise show about the standard deviation? O The idea is to illustrate that the standard deviation is not a function of the value of the mean. O The idea is to illustrate that the standard deviation is a function of the value of the mean.

Chapter5: Decimals
Section5.5: Averages And Probability
Problem 400E: The cash register receipts each day last week at a coffee shop were $1,845. $1,520. $1,438, $1,682,...

Related questions
Topic Video
Question
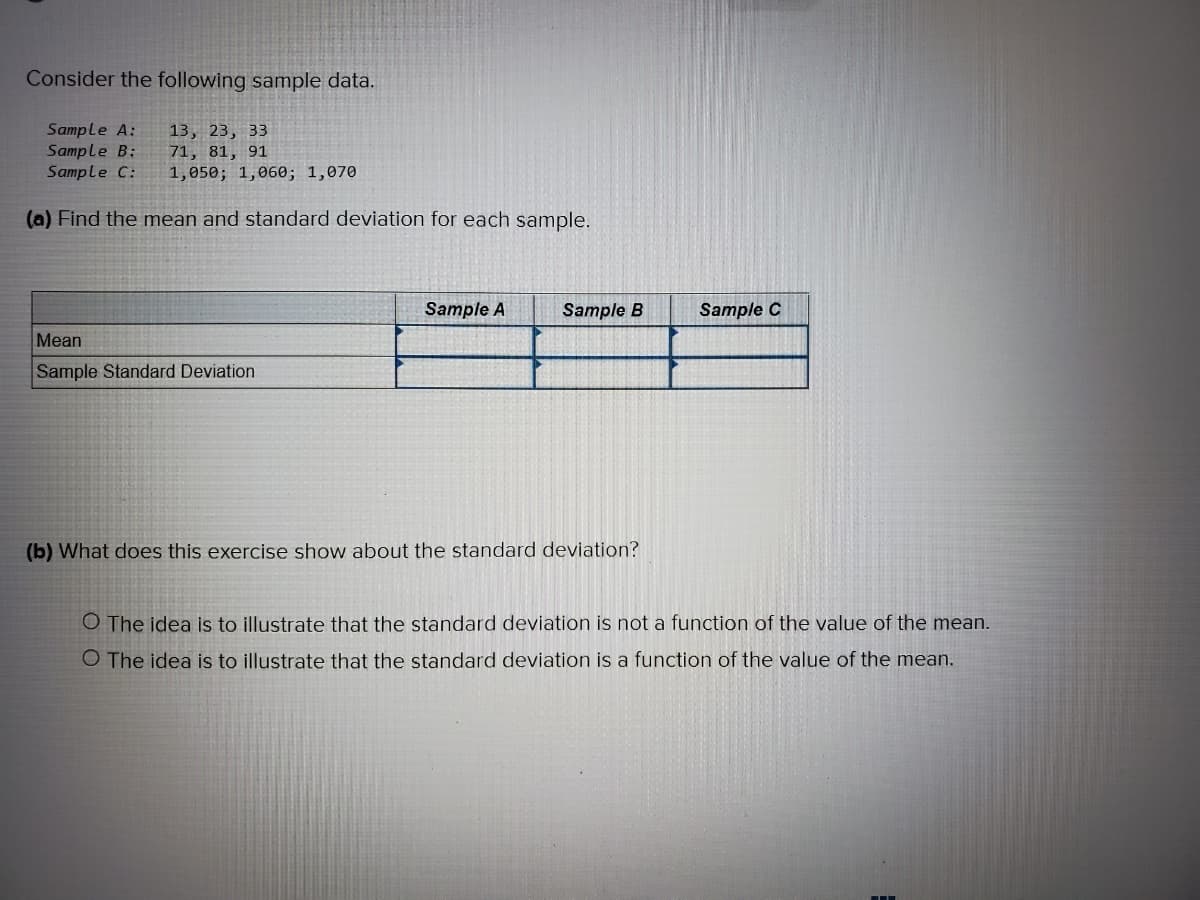
Transcribed Image Text:Consider the following sample data.
Sample A:
Sample B:
Sample C:
13, 23, 33
71, 81, 91
1,050; 1,060; 1,070
(a) Find the mean and standard deviation for each sample.
Sample A
Sample B
Sample C
Mean
Sample Standard Deviation
(b) What does this exercise show about the standard deviation?
O The idea is to illustrate that the standard deviation is not a function of the value of the mean.
O The idea is to illustrate that the standard deviation is a function of the value of the mean.
Transcribed Image Text:Saved
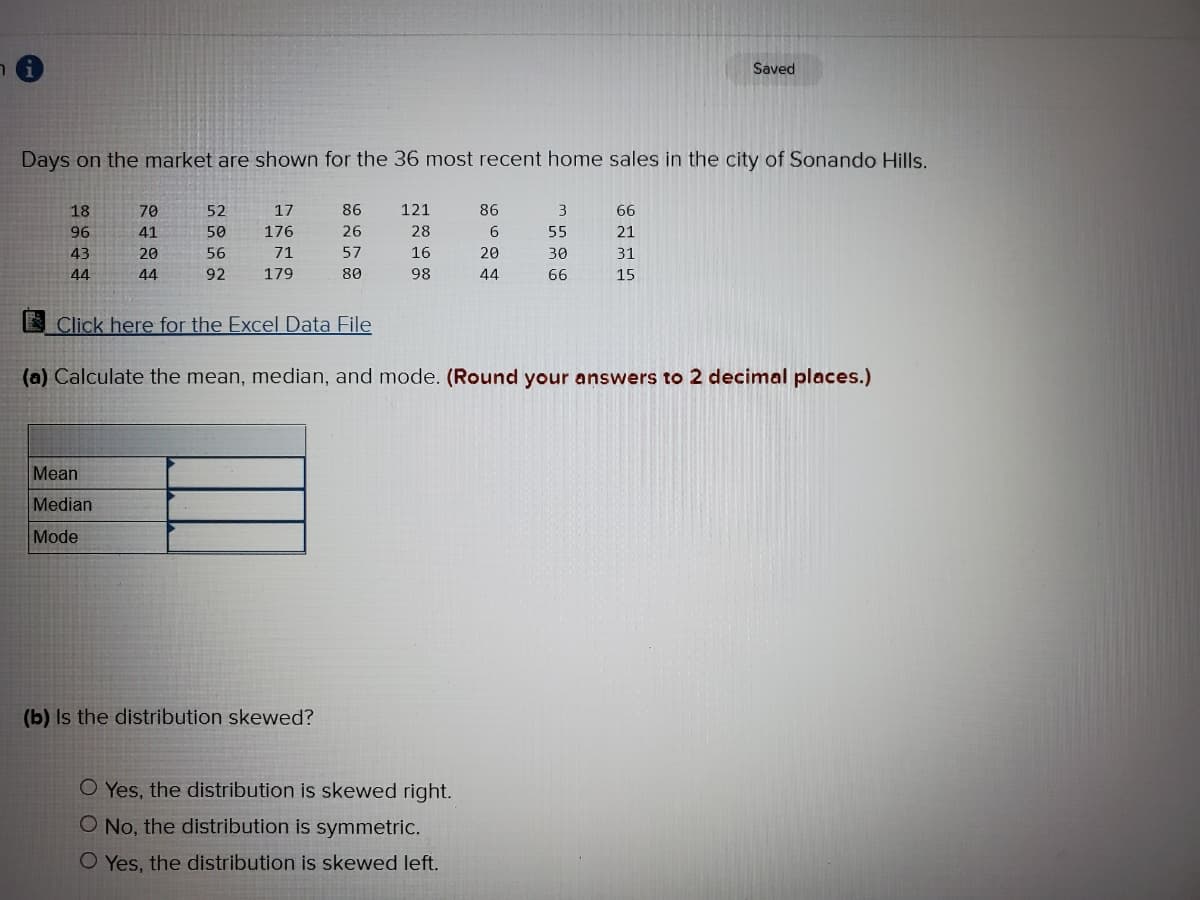
Days on the market are shown for the 36 most recent home sales in the city of Sonando Hills.
18
70
52
17
86
121
86
66
96
41
50
176
26
28
6.
55
21
43
20
56
71
57
16
20
30
31
44
44
92
179
80
98
44
66
15
E Click here for the Excel Data File
(a) Calculate the mean, median, and mode. (Round your answers to 2 decimal places.)
Mean
Median
Mode
(b) Is the distribution skewed?
O Yes, the distribution is skewed right.
O No, the distribution is symmetric.
O Yes, the distribution is skewed left.
Expert Solution
This question has been solved!
Explore an expertly crafted, step-by-step solution for a thorough understanding of key concepts.

This is a popular solution!

Trending now
This is a popular solution!

Step by step
Solved in 3 steps with 3 images

Knowledge Booster


Learn more about
Need a deep-dive on the concept behind this application? Look no further. Learn more about this topic, statistics and related others by exploring similar questions and additional content below.Recommended textbooks for you

Glencoe Algebra 1, Student Edition, 9780079039897…
Algebra
ISBN:
9780079039897
Author:
Carter
Publisher:
McGraw Hill
Glencoe Algebra 1, Student Edition, 9780079039897…
Algebra
ISBN:
9780079039897
Author:
Carter
Publisher:
McGraw Hill