Consider the following sets of replicate measurements: For each set, calculate the standard deviation, relative standard deviation in ppt, and
Consider the following sets of replicate measurements: For each set, calculate the standard deviation, relative standard deviation in ppt, and

Glencoe Algebra 1, Student Edition, 9780079039897, 0079039898, 2018
18th Edition
ISBN:9780079039897
Author:Carter
Publisher:Carter
Chapter10: Statistics
Section10.4: Distributions Of Data
Problem 19PFA

Related questions
Question
chem laboratory
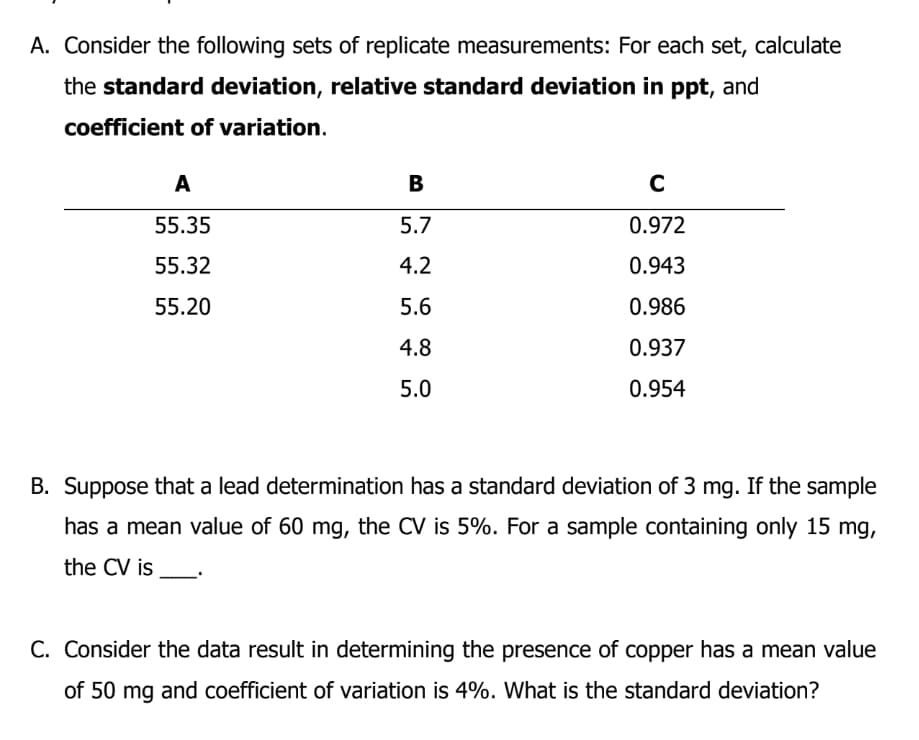
Transcribed Image Text:A. Consider the following sets of replicate measurements: For each set, calculate
the standard deviation, relative standard deviation in ppt, and
coefficient of variation.
A
В
55.35
5.7
0.972
55.32
4.2
0.943
55.20
5.6
0.986
4.8
0.937
5.0
0.954
B. Suppose that a lead determination has a standard deviation of 3 mg. If the sample
has a mean value of 60 mg, the CV is 5%. For a sample containing only 15 mg,
the CV is
C. Consider the data result in determining the presence of copper has a mean value
of 50 mg and coefficient of variation is 4%. What is the standard deviation?
Expert Solution
This question has been solved!
Explore an expertly crafted, step-by-step solution for a thorough understanding of key concepts.

Step by step
Solved in 3 steps

Recommended textbooks for you
Glencoe Algebra 1, Student Edition, 9780079039897…
Algebra
ISBN:
9780079039897
Author:
Carter
Publisher:
McGraw Hill
Glencoe Algebra 1, Student Edition, 9780079039897…
Algebra
ISBN:
9780079039897
Author:
Carter
Publisher:
McGraw Hill