Consider the following statements. Which of the following is NOT ALWAYS TRUE? 1. A small value for a measure of dispersion indicates that the data are clustered closely around the arithmetic mean. A line chart is ideal for portraying the trend of data over a period of time. The unorganized observations (collected sample) are referred to as raw data. IV. I. I. The median is a numeric value separating the higher 3/4ths of a sample/population/population distribution and the lower 1/4ths. O I only O I and II O III and IV IV only
Consider the following statements. Which of the following is NOT ALWAYS TRUE? 1. A small value for a measure of dispersion indicates that the data are clustered closely around the arithmetic mean. A line chart is ideal for portraying the trend of data over a period of time. The unorganized observations (collected sample) are referred to as raw data. IV. I. I. The median is a numeric value separating the higher 3/4ths of a sample/population/population distribution and the lower 1/4ths. O I only O I and II O III and IV IV only

Glencoe Algebra 1, Student Edition, 9780079039897, 0079039898, 2018
18th Edition
ISBN:9780079039897
Author:Carter
Publisher:Carter
Chapter10: Statistics
Section10.4: Distributions Of Data
Problem 19PFA

Related questions
Question
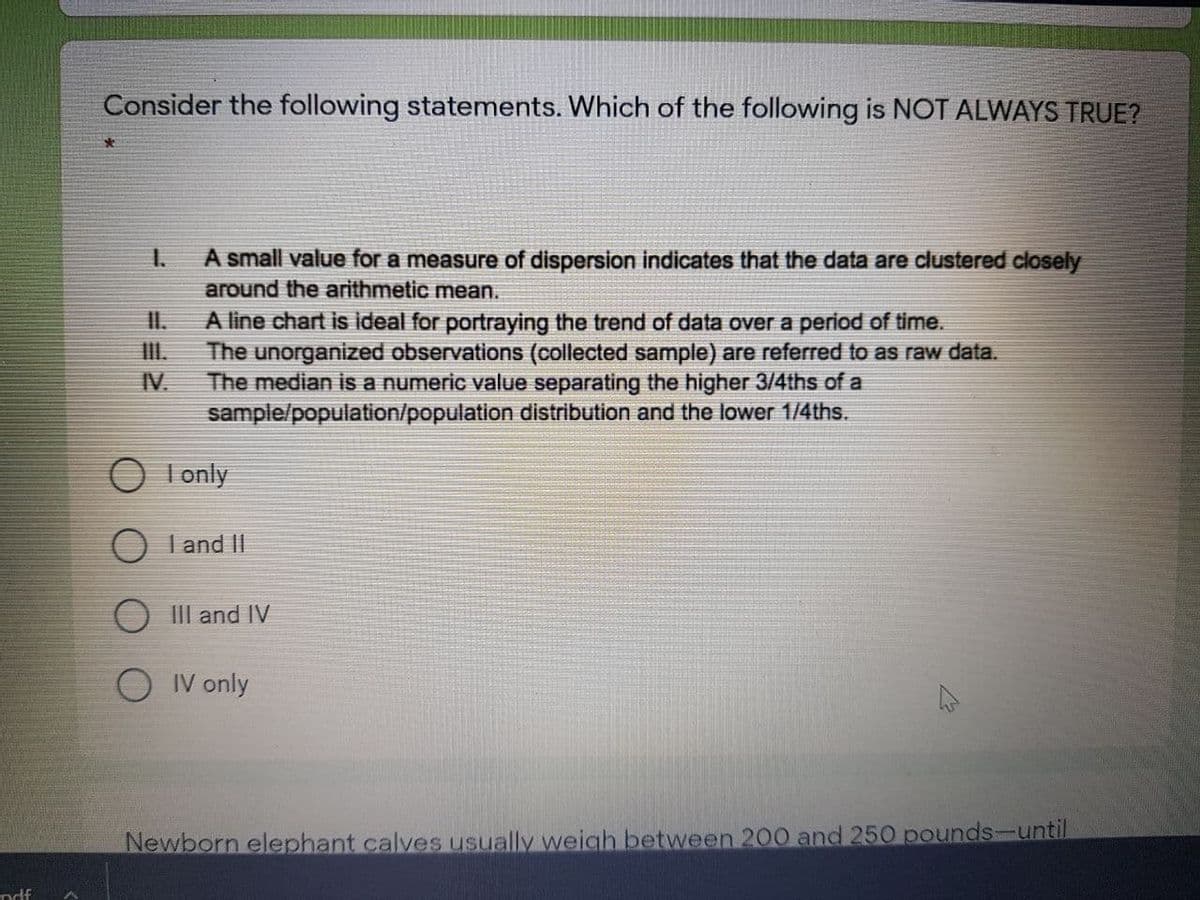
Transcribed Image Text:Consider the following statements. Which of the following is NOT ALWAYS TRUE?
A small value for a measure of dispersion indicates that the data are clustered closely
around the arithmetic mean.
1.
I.
A line chart is ideal for portraying the trend of data over a period of time.
III.
The unorganized observations (collected sample) are referred to as raw data.
IV.
The median is a numeric value separating the higher 3/4ths of a
sample/population/population distribution and the lower 1/4ths.
O I only
O I and II
O III and IV
O IV only
Newborn elephant calves usually weigh between 200 and 250 pounds-until
ndf
Expert Solution
This question has been solved!
Explore an expertly crafted, step-by-step solution for a thorough understanding of key concepts.

Step by step
Solved in 2 steps

Recommended textbooks for you
Glencoe Algebra 1, Student Edition, 9780079039897…
Algebra
ISBN:
9780079039897
Author:
Carter
Publisher:
McGraw Hill
Glencoe Algebra 1, Student Edition, 9780079039897…
Algebra
ISBN:
9780079039897
Author:
Carter
Publisher:
McGraw Hill