Consider the following time series. 2 3 4 6 121 111 105 99 95 93 89 (a) Construct a time series plot. What type of pattern exists in the data? O The time series plot shows a linear trend. O The time series plot shows a seasonal pattern. O The time series plot shows a nonlinear trend. O The time series plot shows a horizontal pattern. (b) Use simple linear regression analysis to find the parameters for the line that minimizes MSE for this time series. (Round your answers to two decimal places.) bo = b, = (c) What is the forecast for t = 8? (Round your answer to one decimal place.)
Consider the following time series. 2 3 4 6 121 111 105 99 95 93 89 (a) Construct a time series plot. What type of pattern exists in the data? O The time series plot shows a linear trend. O The time series plot shows a seasonal pattern. O The time series plot shows a nonlinear trend. O The time series plot shows a horizontal pattern. (b) Use simple linear regression analysis to find the parameters for the line that minimizes MSE for this time series. (Round your answers to two decimal places.) bo = b, = (c) What is the forecast for t = 8? (Round your answer to one decimal place.)

College Algebra
7th Edition
ISBN:9781305115545
Author:James Stewart, Lothar Redlin, Saleem Watson
Publisher:James Stewart, Lothar Redlin, Saleem Watson
Chapter1: Equations And Graphs
Section: Chapter Questions
Problem 10T: Olympic Pole Vault The graph in Figure 7 indicates that in recent years the winning Olympic men’s...

Related questions
Question
Please answer b and c
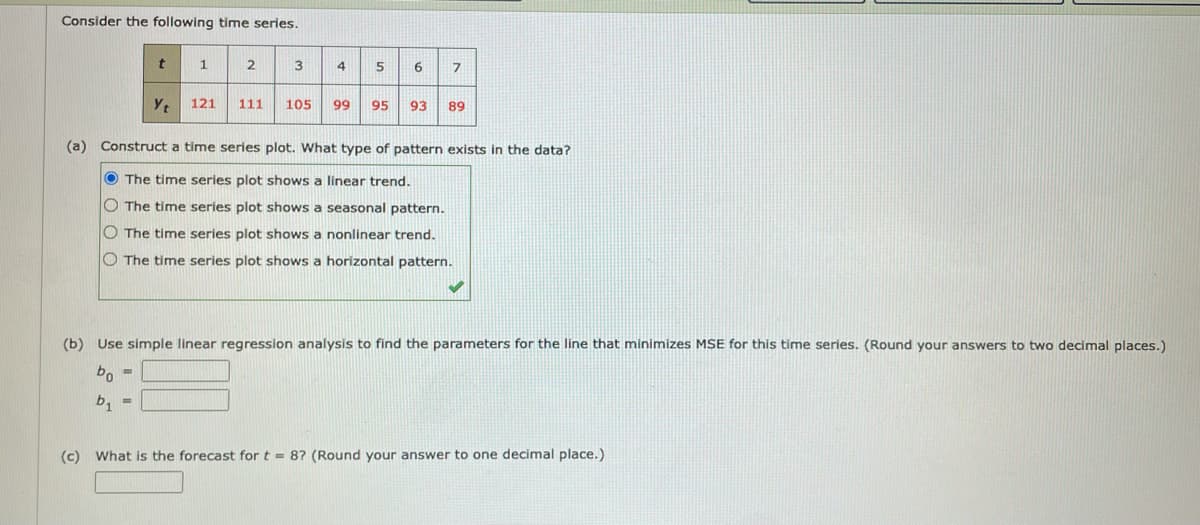
Transcribed Image Text:Consider the following time series.
3
4
5
6
121
111
105
99
95
93
89
(a) Construct a time series plot. What type of pattern exists in the data?
O The time series plot shows a linear trend.
O The time series plot shows a seasonal pattern.
O The time series plot shows a nonlinear trend.
O The time series plot shows a horizontal pattern.
(b) Use simple linear regression analysis to find the parameters for the line that minimizes MSE for this time series. (Round your answers to two decimal places.)
bo =
b, =
(c) What is the forecast for t = 87 (Round your answer to one decimal place.)
Expert Solution
This question has been solved!
Explore an expertly crafted, step-by-step solution for a thorough understanding of key concepts.

Step by step
Solved in 4 steps with 4 images

Recommended textbooks for you
College Algebra
Algebra
ISBN:
9781305115545
Author:
James Stewart, Lothar Redlin, Saleem Watson
Publisher:
Cengage Learning
College Algebra
Algebra
ISBN:
9781305115545
Author:
James Stewart, Lothar Redlin, Saleem Watson
Publisher:
Cengage Learning