
Algebra & Trigonometry with Analytic Geometry
13th Edition
ISBN:9781133382119
Author:Swokowski
Publisher:Swokowski
Chapter4: Polynomial And Rational Functions
Section4.1: Polynomial Functions Of Degree Greater Than
Problem 56E

Related questions
Question
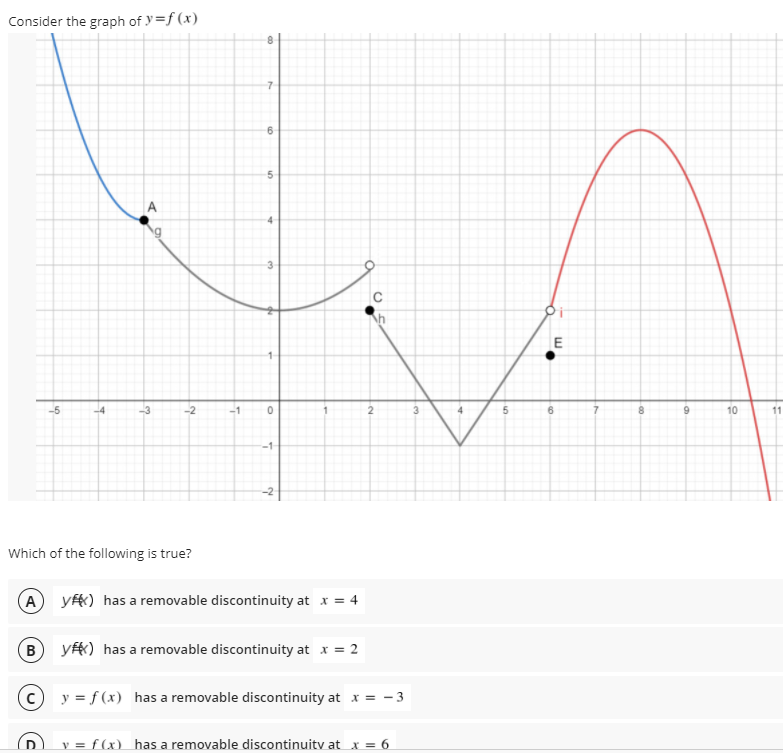
Transcribed Image Text:Consider the graph of y=f (x)
7
6
5
4
3
C
-5
-1
6.
8.
10
11
-1
Which of the following is true?
A yf) has a removable discontinuity at x = 4
B
yf) has a removable discontinuity at x = 2
y = f (x) has a removable discontinuity at x = - 3
y = f (x) has a removable discontinuitv at x = 6
Expert Solution
This question has been solved!
Explore an expertly crafted, step-by-step solution for a thorough understanding of key concepts.

Step by step
Solved in 2 steps with 2 images

Recommended textbooks for you
Algebra & Trigonometry with Analytic Geometry
Algebra
ISBN:
9781133382119
Author:
Swokowski
Publisher:
Cengage
Algebra & Trigonometry with Analytic Geometry
Algebra
ISBN:
9781133382119
Author:
Swokowski
Publisher:
Cengage