Consider the list L1 = {1, 3, 4, 5, 7}. The standard deviation of L1 is 2. If we add 5 to each number in L1, we get L2 = (6, 8, 9, 10, 12). The standard deviation of L2 is 3) The area under any histogram is percent. 4)
Consider the list L1 = {1, 3, 4, 5, 7}. The standard deviation of L1 is 2. If we add 5 to each number in L1, we get L2 = (6, 8, 9, 10, 12). The standard deviation of L2 is 3) The area under any histogram is percent. 4)

Linear Algebra: A Modern Introduction
4th Edition
ISBN:9781285463247
Author:David Poole
Publisher:David Poole
Chapter7: Distance And Approximation
Section7.3: Least Squares Approximation
Problem 31EQ

Related questions
Question
Do not do questions 2 or 5

Transcribed Image Text:7:50
Drive
5)
Suppose we have a scatter diagram for the heights of 3,000 pairs of fathers and sons. The summary statistics are:
average height of fathers = 80 inches
SD = 6 inches
average height of sons = 78 inches
SD = 3 inches,
r 0.6
The linear regression line for predicting height of the father(y variable) from the height of their sons(x variable) has slope
6)
(12 pts) Consider the complete histogram below containing the hourly rate of substitute teachers in a certain district.
30
20
20
10
10
1
2
3
4
5
6
7
Wages (tens of dollars)
a. Find the percentage of teachers who are paid between $30 per hour and $60 per hour.
b. Find the value of x in the picture above so make this a valid and complete histogram. Note that the height of the square under "x" is
not drawn to scale.
7)
Consider the list (4, 8, 7, 3, 13).
a) Compute the mean of the list.
b) Compute the standard deviation of the list.
8)
The average Math SAT score for a certain year was 540 with
standard deviation of 60. Assume that the distribution follows the normal
curve.
a) Find the percentage of students who scored higher than 650.
b) Find the percentage of students who scored between 480 and 700.
c) Suppose that a student scored higher than 80% of the student population. What was his score?
9)
The Math and Verbal SAT scores for the entering class at a certain college is summarized below:
average Math SAT = 540, SD = 70
average Verbal SAT = 560, SD = 110
r= 0.55
The investigator wants to use the Verbal score(x) to predict the Math score(y).
a. Find the linear regression equation. Write the answer in y = mx + b.
b. Use the linear regression equation to predict the Math score of a student who receives a 550 on the Verbal portion of the test
c. If a student's Verbal percentile rank is 40%, i.e, his score is higher than 40% of the students taking the test, what is his percentile rank
on the Math portion?
10)
(12 pts) Compute the correlation r for the following table of values. YOU MUST USE THE METHOD DISCUSSED IN LECTURE FOR FULL
CREDIT! Show all work!
HINT: YOU MUST USE these values in your calculations.
Average for x-values = 3
SD for x values = 2
Average for y-values = 6
SD for y values = 4
y
X
2
3
4
12
% per $10
Transcribed Image Text:7:50
Drive
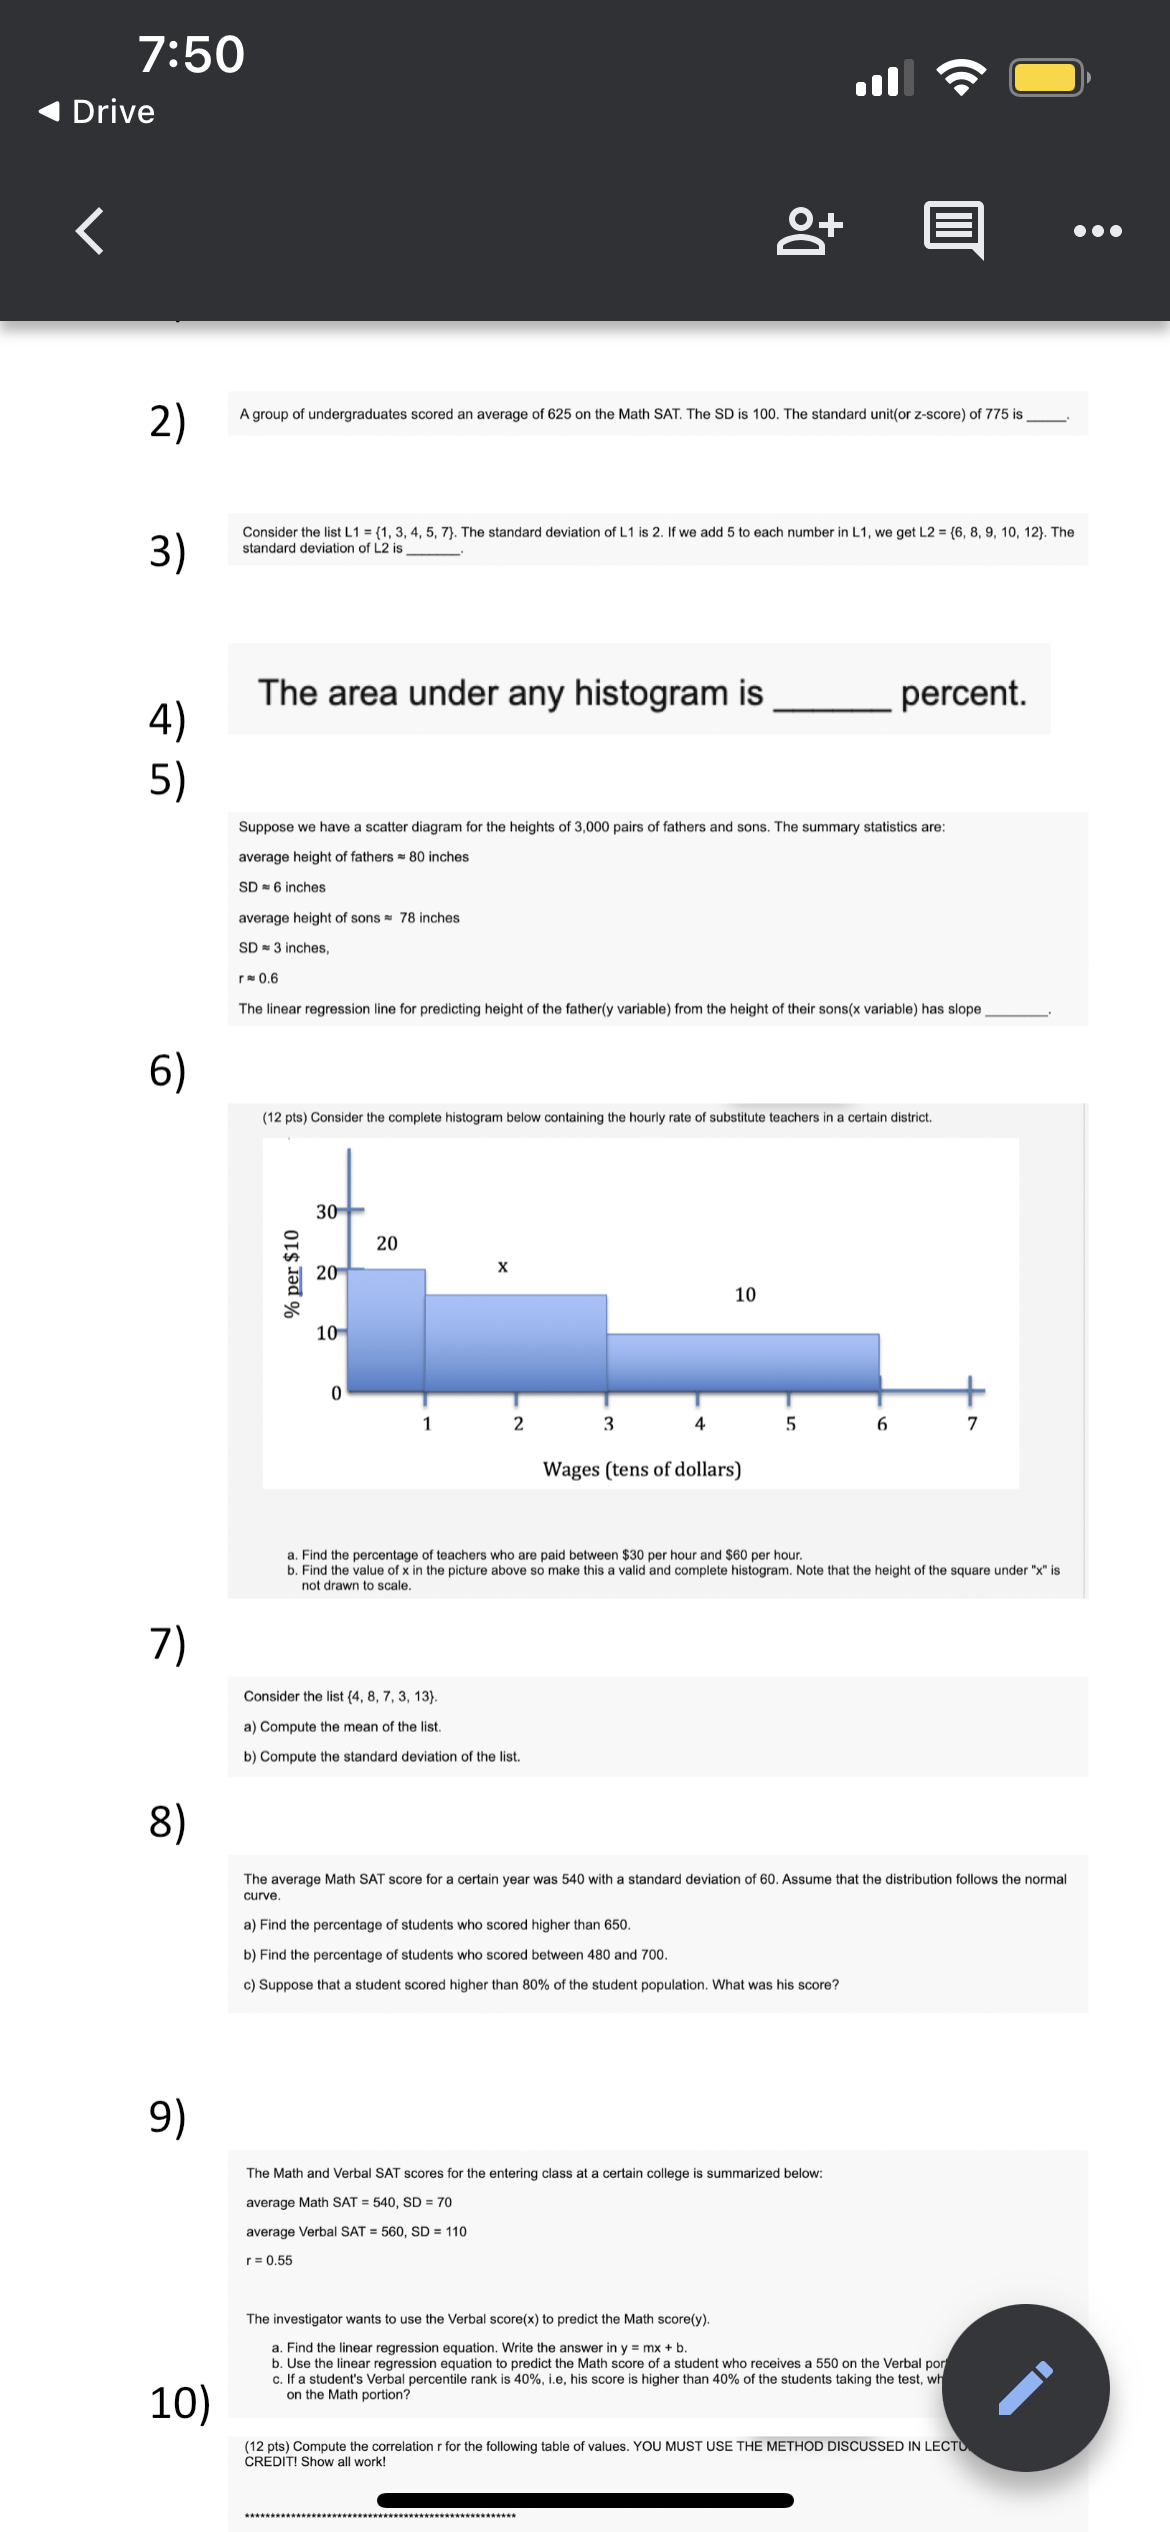
2)
A group of undergraduates scored an average of 625 on the Math SAT. The SD is 100. The standard unit(or z-score) of 775 is
3)
Consider the list L1 = {1, 3, 4, 5, 7}. The standard deviation of L1 is 2. If we add 5 to each number in L1, we get L2 = {6, 8, 9, 10, 12}. The
standard deviation of L2 is
The area under any histogram is
4)
percent.
5)
Suppose we have a scatter diagram for the heights of 3,000 pairs of fathers and sons. The summary statistics are:
average height of fathers = 80 inches
SD 6 inches
average height of sons = 78 inches
SD - 3 inches,
r 0,6
The linear regression line for predicting height of the father(y variable) from the height of their sons(x variable) has slope
6)
(12 pts) Consider the complete histogram below containing the hourly rate of substitute teachers in a certain district.
30
20
20
10
10
1
2
3
4
6
7
Wages (tens of dollars)
a. Find the percentage of teachers who are paid between $30 per hour and $60 per hour.
b. Find the value of x in the picture above so make this a valid and complete histogram. Note that the height of the square under "x" is
not drawn to scale.
7)
Consider the list (4, 8, 7, 3, 13}.
a) Compute the mean of the list.
b) Compute the standard deviation of the list.
8)
The average Math SAT score for a certain year was 540 with a standard deviation of 60. Assume that the distribution follows the normal
curve.
a) Find the percentage of students who scored higher than 650.
b) Find the percentage of students who scored between 480 and 700.
c) Suppose that a student scored higher than 80% of the student population. What was his score?
9)
The Math and Verbal SAT scores for the entering class at a certain college is summarized below:
average Math SAT = 540, SD = 70
average Verbal SAT = 560, SD = 110
r= 0.55
The investigator wants to use the Verbal score(x) to predict the Math score(y).
a. Find the linear regression equation. Write the answer in y = mx + b
b. Use the linear regression equation to predict the Math score of a student who receives a 550 on the Verbal por
c. If a student's Verbal percentile rank is 40%, i.e, his score is higher than 40% of the students taking the test, wh
on the Math portion?
10)
(12 pts) Compute the correlation r for the following table of values. YOU MUST USE THE METHOD DISCUSSED IN LECTU
CREDIT! Show all work!
% per $10
Expert Solution
This question has been solved!
Explore an expertly crafted, step-by-step solution for a thorough understanding of key concepts.

This is a popular solution!

Trending now
This is a popular solution!

Step by step
Solved in 2 steps

Recommended textbooks for you
Linear Algebra: A Modern Introduction
Algebra
ISBN:
9781285463247
Author:
David Poole
Publisher:
Cengage Learning
Linear Algebra: A Modern Introduction
Algebra
ISBN:
9781285463247
Author:
David Poole
Publisher:
Cengage Learning