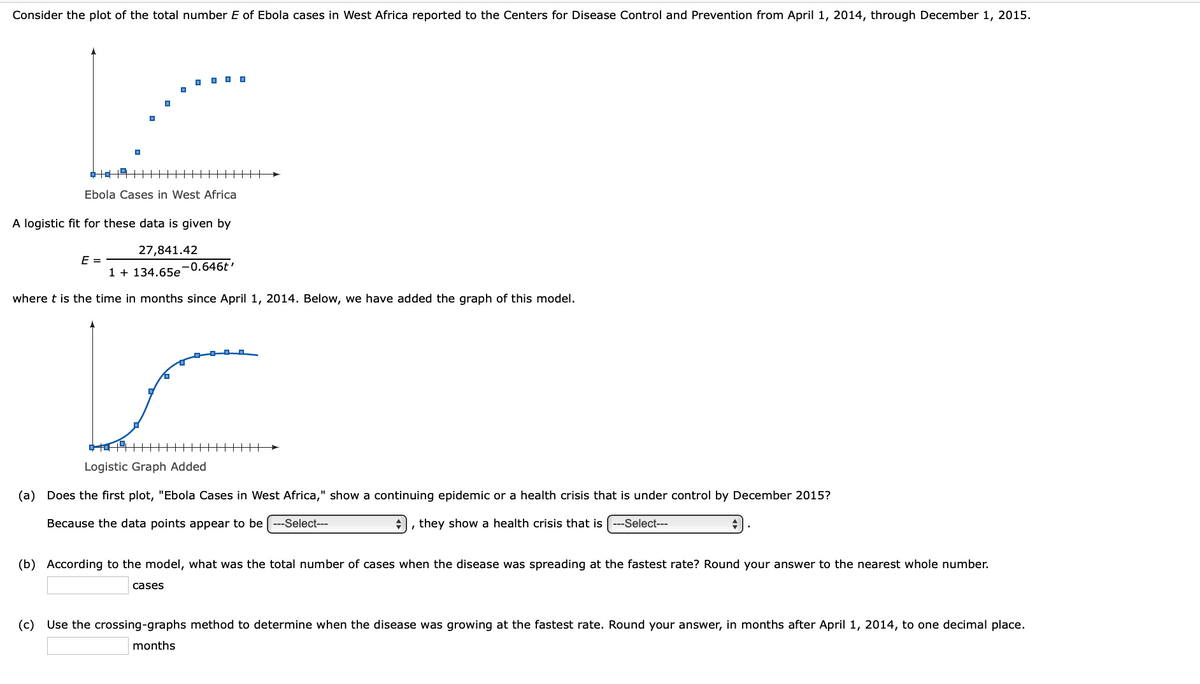
Consider the plot of the total number E of Ebola cases in West Africa reported to the Centers for Disease Control and Prevention from April 1, 2014, through December 1, 2015. Ebola Cases in West Africa A logistic fit for these data is given by 27,841.42 E = 1+ 134,65e-0.646t where t is the time in months since April 1, 2014. Below, we have added the graph of this model. Logistic Graph Added (a) Does the first plot, "Ebola Cases in West Africa," show a continuing epidemic or a health crisis that is under control by December 2015? Because the data points appear to be --Select--- they show a health crisis that is --Select--- (b) According to the model, what was the total number of cases when the disease was spreading at the fastest rate? Round your answer to the nearest whole number. cases (c) Use the crossing-graphs method to determine when the disease was growing at the fastest rate. Round your answer, in months after April 1, 2014, to one decimal place. months
Consider the plot of the total number E of Ebola cases in West Africa reported to the Centers for Disease Control and Prevention from April 1, 2014, through December 1, 2015. Ebola Cases in West Africa A logistic fit for these data is given by 27,841.42 E = 1+ 134,65e-0.646t where t is the time in months since April 1, 2014. Below, we have added the graph of this model. Logistic Graph Added (a) Does the first plot, "Ebola Cases in West Africa," show a continuing epidemic or a health crisis that is under control by December 2015? Because the data points appear to be --Select--- they show a health crisis that is --Select--- (b) According to the model, what was the total number of cases when the disease was spreading at the fastest rate? Round your answer to the nearest whole number. cases (c) Use the crossing-graphs method to determine when the disease was growing at the fastest rate. Round your answer, in months after April 1, 2014, to one decimal place. months

Linear Algebra: A Modern Introduction
4th Edition
ISBN:9781285463247
Author:David Poole
Publisher:David Poole
Chapter6: Vector Spaces
Section6.7: Applications
Problem 14EQ

Related questions

Concept explainers
Contingency Table
A contingency table can be defined as the visual representation of the relationship between two or more categorical variables that can be evaluated and registered. It is a categorical version of the scatterplot, which is used to investigate the linear relationship between two variables. A contingency table is indeed a type of frequency distribution table that displays two variables at the same time.
Binomial Distribution
Binomial is an algebraic expression of the sum or the difference of two terms. Before knowing about binomial distribution, we must know about the binomial theorem.
Topic Video
Question
Transcribed Image Text:Consider the plot of the total number E of Ebola cases in West Africa reported to the Centers for Disease Control and Prevention from April 1, 2014, through December 1, 2015.
O O O O
Ebola Cases in West Africa
A logistic fit for these data is given by
27,841.42
E =
1 + 134.65e-0.646t'
where t is the time in months since April 1, 2014. Below, we have added the graph of this model.
Logistic Graph Added
(a) Does the first plot, "Ebola Cases in West Africa," show a continuing epidemic or a health crisis that is under control by December 2015?
Because the data points appear to be ---Select---
+, they show a health crisis that is ---Select---
(b) According to the model, what was the total number of cases when the disease was spreading at the fastest rate? Round your answer to the nearest whole number.
cases
(c)
Use the crossing-graphs method to determine when the disease was growing at the fastest rate. Round your answer, in months after April 1, 2014, to one decimal place.
months
Expert Solution
This question has been solved!
Explore an expertly crafted, step-by-step solution for a thorough understanding of key concepts.

This is a popular solution!

Trending now
This is a popular solution!

Step by step
Solved in 3 steps with 3 images

Knowledge Booster


Learn more about
Need a deep-dive on the concept behind this application? Look no further. Learn more about this topic, calculus and related others by exploring similar questions and additional content below.Recommended textbooks for you
Linear Algebra: A Modern Introduction
Algebra
ISBN:
9781285463247
Author:
David Poole
Publisher:
Cengage Learning

College Algebra (MindTap Course List)
Algebra
ISBN:
9781305652231
Author:
R. David Gustafson, Jeff Hughes
Publisher:
Cengage Learning

Linear Algebra: A Modern Introduction
Algebra
ISBN:
9781285463247
Author:
David Poole
Publisher:
Cengage Learning
College Algebra (MindTap Course List)
Algebra
ISBN:
9781305652231
Author:
R. David Gustafson, Jeff Hughes
Publisher:
Cengage Learning

Algebra & Trigonometry with Analytic Geometry
Algebra
ISBN:
9781133382119
Author:
Swokowski
Publisher:
Cengage